. 2021 Jul 30;10:e61248. doi: 10.7554/eLife.61248

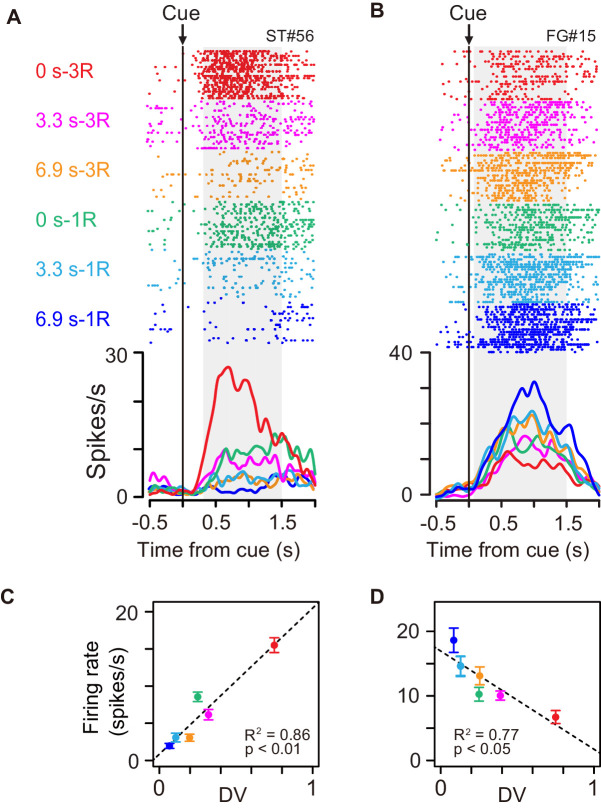
Figure 3. Cue responses of temporally discounted value coding.

(A, B) Activity of example neurons during cue period. Rasters and spike density histograms are aligned at cue onset. The color corresponds to each reward condition. Rasters are shown in order of occurrence of trials from bottom to top in each condition. Shaded areas on rasters are time windows for evaluating the magnitude of cue response. (C, D) Relationship between firing rate (mean ± sem) and temporally discounted value (DV, Equation 1) for neuronal activities shown in (A) and (B), respectively.

Figure 3.

Figure 3—figure supplement 1. Error trial analysis.

Figure 3—figure supplement 1.

Table shows that the number of neurons whose activity is explained best by models 1–4. Note that linear mixed model (LMM) analysis was applied to 22 of 27 DV-coding neurons recorded in a session in which the monkeys made at least three error trials. fr, firing rate; dv, discounted value; trial, trial type (correct or error). Seventeen neurons were differently modulated by DV depending on whether the monkey perform correct or not, while remaining five were similarly modulated regardless of performance.
Figure 3—figure supplement 2. Error trial analysis.
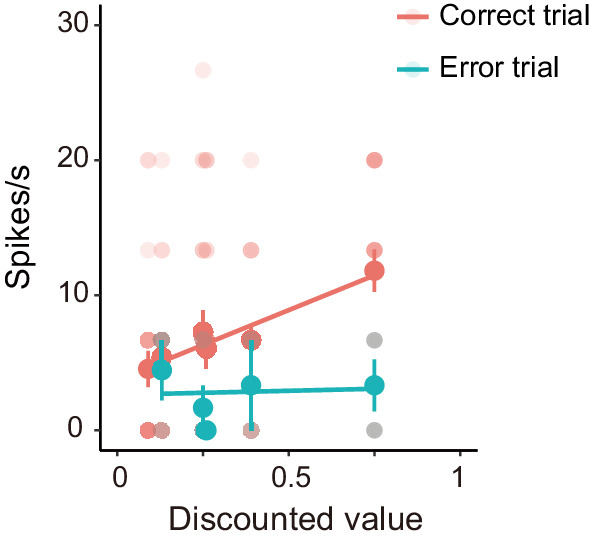
Figure 3—figure supplement 2.

Example of differential activity between error and correct trials of a DV-coding neuron. Thin and thick dots indicate relationship between firing rate and temporally discounted value (Equation 1) in individual trials and mean values for each rewarding condition, respectively. Color indicate correct (red) and error (green) trials, respectively. Thick lines indicate best-fit of LMM (model four in Figure 3—figure supplement 1).