. 2021 Jul 30;10:e61248. doi: 10.7554/eLife.61248

Figure 4. Impact of DV and comparison with delay and size on cue response.

(A, B) Scatterplots of standardized partial regression coefficients (SPRC) of DV (ordinate) against those for reward size or delay (abscissa) for discharge rates during cue period, respectively. Colored dots indicate neurons with significant (p<0.05) coefficient, while gray dots correspond to neurons without any significant effect (NA). DV/DV and Other, neurons with significant coefficient of DV; Size and Delay, those with both size and delay; Size, those exclusively with size; Delay, those exclusively with delay. Numbers in parentheses indicate number of neurons.

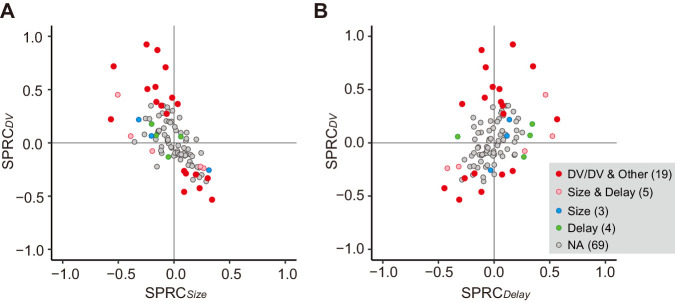
Figure 4.

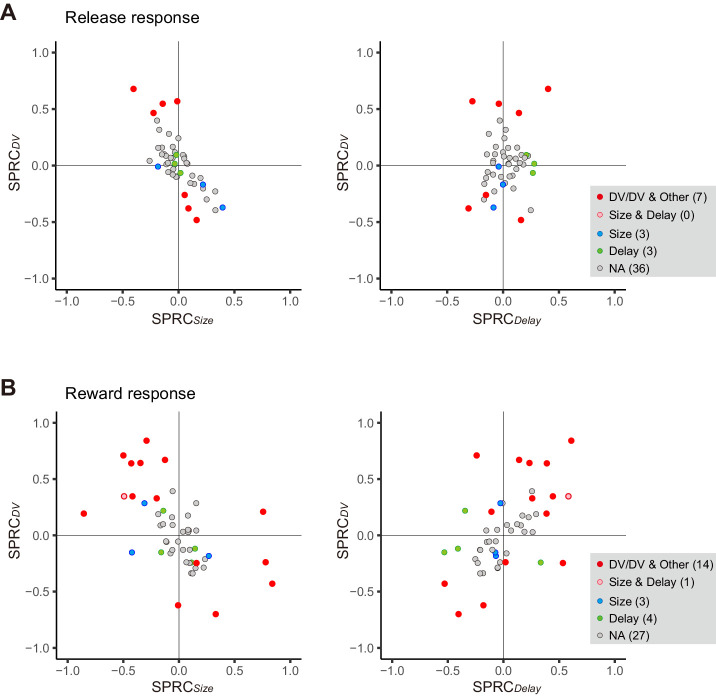
Figure 4—figure supplement 1. Impact of DV and comparison with delay and size on release and reward response.

Figure 4—figure supplement 1.

(A) Scatterplot of standardized partial regression coefficients (SPRC) of DV (ordinate) against those of size and delay on release response, respectively (abscissa). (B) Same as (A), but for reward response. Colored dots indicate neurons with significant (p<0.05) coefficient, while gray dots correspond to neurons without any significant effect (NA). DV/DV and Other, neurons with significant coefficient of DV; Size and Delay, those with both size and delay; Size, those with size exclusively; Delay, those with delay exclusively. Numbers in parentheses indicate number of neurons.