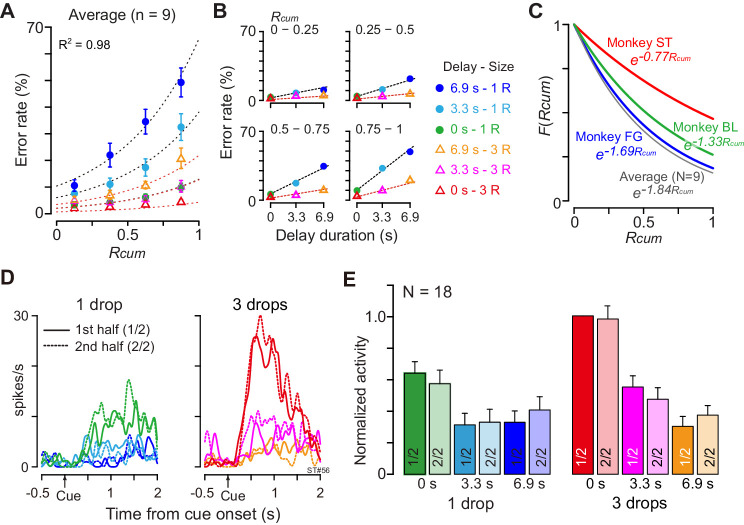
Figure 6. Negligible effect of satiation on DV-coding.
(A) Ratio of error trials (mean ± sem) as a function of normalized cumulative reward (Rcum) on average across nine monkeys. Dotted curves are the best fit of Equation 4 to the data. (B) Error rates (mean ± sem) as a function of delay duration for each quarter of Rcum. (C) Satiation function, F(Rcum), along with Rcum in three individual monkeys and average across nine monkeys. Since average total trials were 934, 512, and 493 in BI, FG, and ST, motivational value became 84%, 67%, and 83% through 120 trials (i.e., 16%, 33%, and 17% devalued), respectively. (D) Example of comparison of cue responses in first and second half of recording period for each reward condition in single dCDh neuron (monkey ST). Spike density histograms are aligned at cue onset; one and three drops in reward size, respectively. (E) Comparison of cue responses in first and second half of recording period for each trial type in positive DV-coding neurons (n = 18). Responses were normalized by firing rate of cue response in immediate large reward trials during first half of the period.


