. 2021 Jul 27;10:e69387. doi: 10.7554/eLife.69387

Figure 3. Remodelers undergo frequent transitions between bound and free states.

(A) Halo-H2B (brown) and Halo-NLS (pink) molecules display well-separated peaks in their diffusion coefficient histograms. (B) An overview of displacement-based HMM classification (vbSPT) to identify transitioning trajectories. After classifying each displacement as either in bound or free state, each trajectory is sub-classified as ‘bound only’, ‘free only’, or ‘transitioning’. (C–I) Left: Overlay of raw histograms of log10 diffusion coefficients for ‘Bsound only’ (turquoise), ‘Free only’ (yellow), ‘Transitioning’ (purple), and total trajectories (thin black). Right: Quantification (%) of transitioning trajectories in the diffusion coefficient histogram, where errors represent standard deviation between two [or three for ISW2] biological replicates. (C) Transitioning trajectories for Halo-H2B (top) and Halo-NLS (bottom). (D–I) Transitioning trajectories for remodelers: Sth1-Halo (D), Snf2-Halo (E), Ino80-Halo (F), and Isw2-Halo (G), Chd1-Halo (H), and Isw1-Halo (I).

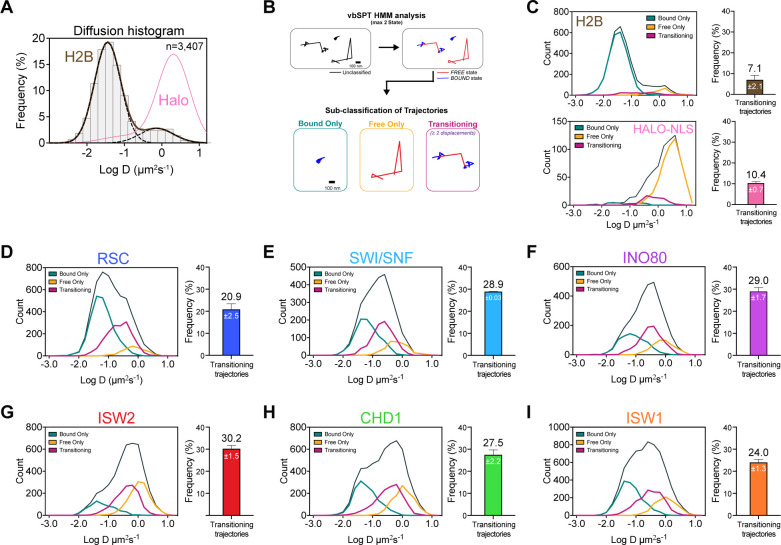
Figure 3—source data 1. vbSPT analysis.

Figure 3.

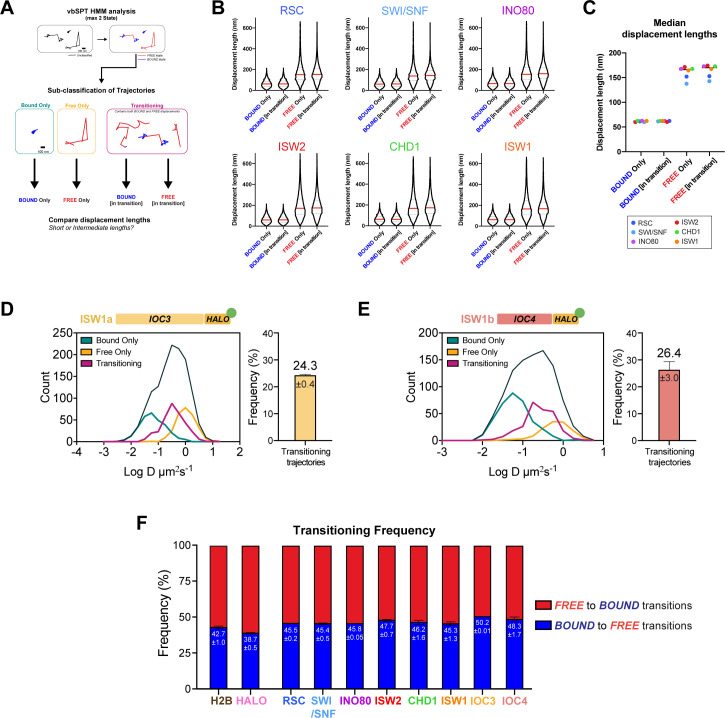
Figure 3—figure supplement 1. Validation of two diffusive states classified by vbSPT, and quantification of transitioning frequencies.

Figure 3—figure supplement 1.

(A) Pipeline for classification and sub-classification of trajectories using vbSPT. Individual displacement lengths were determined for ‘bound only’, ‘free only’, and ‘transitioning’-subclassified trajectories to validate the two states and state transitions. (B–C) Violin plot (B) and median value (C) of individual displacement lengths for the Bound and Free states in non-transitioning and transitioning trajectories. For violin plots, thick red and dotted gray lines represent the median and two quartiles, respectively. (D–E) Transitioning trajectories for Ioc3-Halo (D) and Ioc4-Halo (E). Left: Overlay of raw histograms of log10 diffusion coefficients for ‘Bound only’ (turquoise), ‘Free only’ (yellow), ‘Transitioning’ (purple), and total trajectories (thin black). Right: Quantification (%) of transitioning trajectories in the diffusion coefficient histogram. (F) For all classified transitioning trajectories, ‘FREE’ to ‘BOUND’ and ‘BOUND’ to ‘FREE’ transition frequencies are indicated. For D–F, errors represent standard deviation between two [or three for ISW2] biological replicates.