. 2021 May 27;10:e68082. doi: 10.7554/eLife.68082

Figure 2. Actin dynamics regulate DdMyo7 recruitment to the cortex.

(A) Dictyostelium co-expressing GFP-DdMyo7 and RFP-Lifeact. (B) Line intensity profile from yellow dotted line in A (circle = beginning, arrowhead indicates end of scan). (C) Cytofluorogram from a representative field of cells showing the colocalization of actin and DdMyo7, r is correlation coefficient. (D) Confocal image series of an extending pseudopod. (E) Normalized linescan intensity profile of DdMyo7 and actin in extending pseudopod along the line from panel D. (F) Intensity correlation of GFP-DdMyo7 and RFP-Lifeact plotted as the average spline fit of 10 extending pseudopodia (SD - light green shading, SEM - dark green shading, see also Figure 2—source data 1). (G) Confocal micrographs of cells expressing GFP-DdMyo7 (top) or RFP-Lifeact (actin, bottom) treated with specified drug. (A,D,G) Scale bar is 10 µm. (H) Cortex:cytoplasm ratio (cortex is 0.8 µm band of cell periphery, cytoplasm is the rest of cell excluding the nucleus) of GFP-DdMyo7 of cells treated with anti-actin drugs, circles are experimental means (see also Table 1). One-way ANOVA with multiple comparison correction, shown to 1% DMSO control, **p<0.01, p****<0.0001.

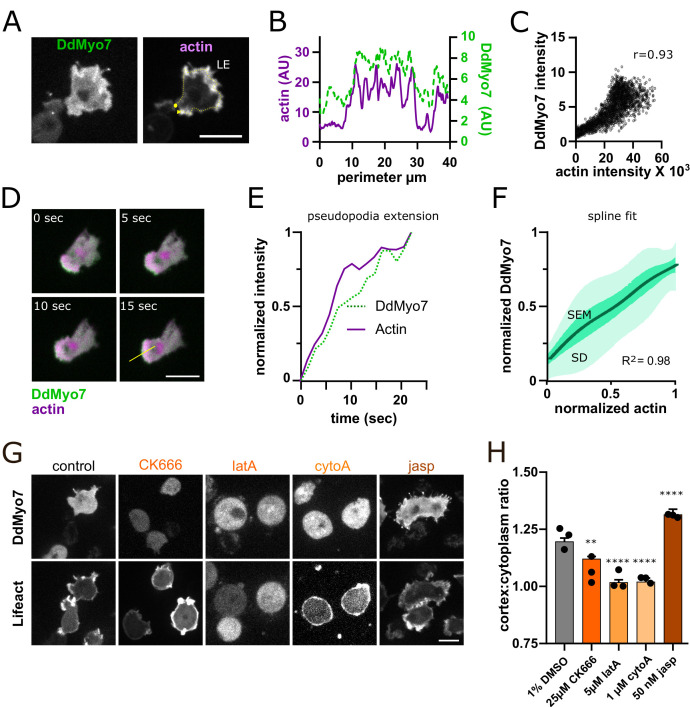
Figure 2—source data 1. Normalized intensity values for each of the 10 extending pseudopodia in Figure 2F.

Figure 2.

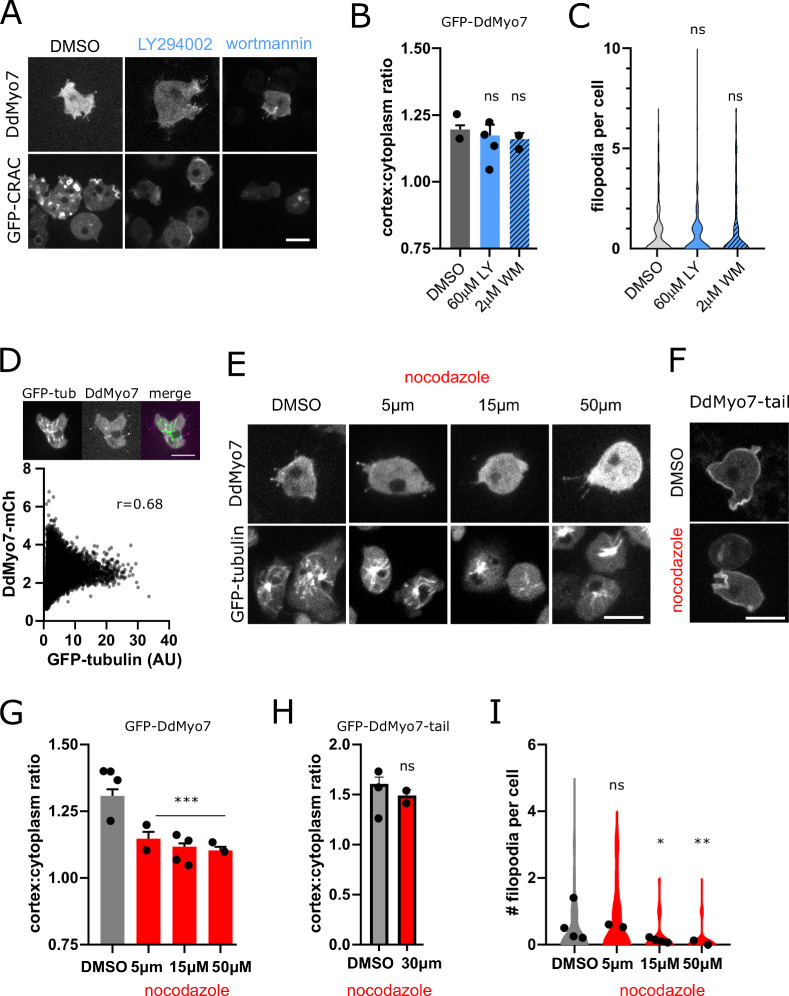
Figure 2—figure supplement 1. Effects of microtubule and membrane phospholipid inhibitors on DdMyo7 targeting and filopodia formation.

Figure 2—figure supplement 1.

(A) Micrographs of cells expressing GFP-DdMyo7 or GFP-CRAC treated with LY294002 (LY), wortmannin (WM). (B) Quantification of GFP-DdMyo7 cortical recruitment. (C) Quantification of filopodia formation. (D) (top) Micrograph of representative cell expressing GFP-tubulin (GFP-tub) and DdMyo7-mCherry and the merged image. (bottom) Cytofluoragram from a representative field of cells of pixel-wise overlap of a cell expressing GFP-tubulin and DdMyo7-mCherry. (E) Micrographs of cells expressing mNeon-DdMyo7 or GFP-tubulin under DMSO (vehicle control) or noted concentration of nocodazole for 20–35 min. (F) Micrograph of cells expressing GFP-DdMyo7 tail fragment under control or 30 µM nocodazole for 30 min. (G) Quantification of DdMyo7 cortical recruitment. (H) Quantification of DdMyo7-tail cortical recruitment. (I) Quantification of filopodia formation. (B–I). Circles on graphs are experimental means. One-way ANOVA with multiple comparison correction to DMSO, ns, not significant, *p<0.05, **p<0.01, ***p<0.0001 (see also Table 1 and Table 1—source data 14). (A–E). Scale bars on micrographs are 10 µm.