. 2021 May 27;10:e68082. doi: 10.7554/eLife.68082

Figure 4. Linear actin polymerization drives DdMyo7 to the cortex.

(A) Image series showing DdMyo7 is absent from latrunculinA-induced actin waves in control (top) or vasp null (bottom) cells. (B) (top) Confocal images of GFP-DdMyo7 in vasp null cells treated with either DMSO or 50 nM jasp treatment. (bottom) Images of vasp null cells expressing GFP or mCherry DdMyo7 and different actin modulating proteins (GFP-V1, green; GFP-dia2WT, green; RFP-dia2CA, magenta). (C, D) Average actin intensity (phalloidin staining, top) of cells through the longest cell axis. The line is the mean and the shaded area is the SEM (graphs, bottom) (see also Figure 4—source data 1). (A–D), Scale bar is 10 µm. (E) Quantification of the cortical band intensity of DdMyo7 in vasp null cells, with no treatment, treated with jasp, or also overexpressing V-1, dia2, or dia2-CA (see also Figure 4—source data 2). (F) Violin plot of filopodia per cell (see also Figure 4—source data 4). (E-F). One-way ANOVA with multiple comparison correction, ns, not significant, **p<0.05, p****<0.0001 (see also Figure 4—source data 3 and 5).

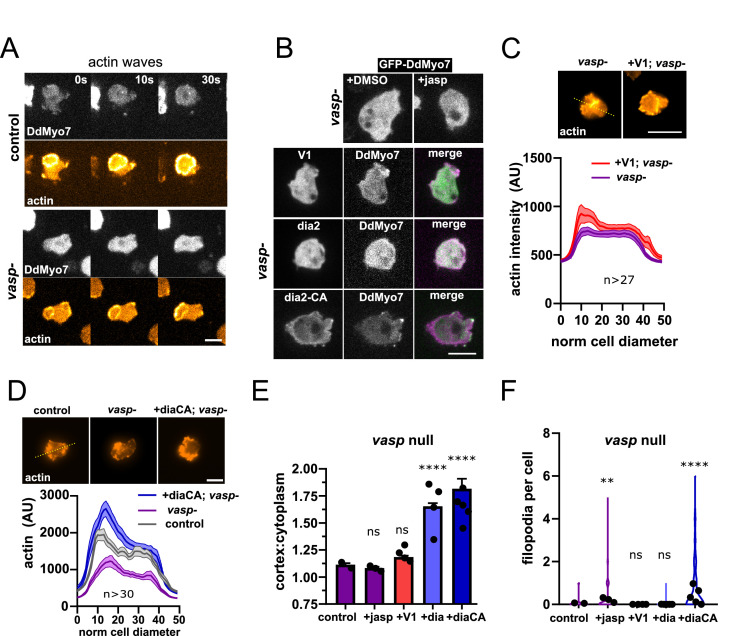
Figure 4—source data 1. Actin line scans for Figure 4C,D.
Figure 4—source data 2. Cortex: cell ratio values for each cell for lines analyzed in Figure 4E.
Figure 4—source data 3. Statistical test results for Figure 4E.
Figure 4—source data 4. Filopodia per cell values for each cell for lines analyzed in Figure 4F.
Figure 4—source data 5. Statistical test results for Figure 4F.

Figure 4.

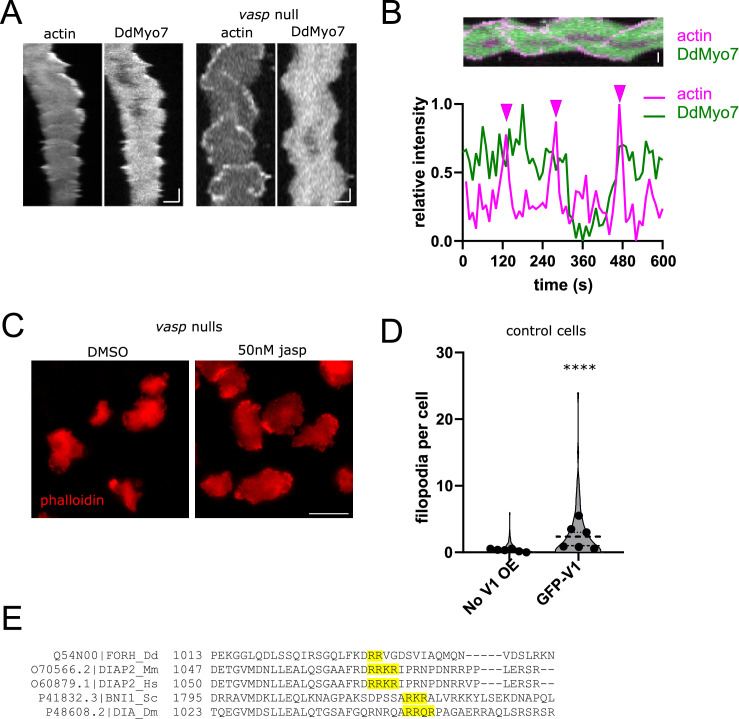
Figure 4—figure supplement 1. Effects of actin modulating drugs and proteins.

Figure 4—figure supplement 1.

(A) Kymographs of cells expressing RFP-LimEΔcoil and GFP-DdMyo7 induced to make actin waves in either control (left) or vasp- cells. Scale bar is (x,y: 5 µm, 30 s). (B) (top) rotated kymograph of vasp- cell, scale bar is 5 µm. (bottom) Plot profile through center of kymograph above during time-lapse of the cell making actin waves. Arrows above point to peak actin intensity (magenta line) which corresponds to wave formation, green line shows DdMyo7 intensity, which is not well correlated with actin waves. (C) Phalloidin staining of vasp null cells treated with either DMSO or 50 nM jasplakinolide (jasp). (D) Quantification of induction of filopodia formation by control cells (no V1 OE) or cells that overexpress GFP-V1 (see also Figure 4—figure supplement 1—source data 1). Student's t-test, ****p<0.001 (see also Figure 4—figure supplement 1—source data 2). (E) Clustal Omega alignment of the DAD region of diaphanous related formins, the conserved basic residues are highlighted in yellow.
Figure 4—figure supplement 1—source data 1. Filopodia per cell values for lines shown in Figure 4—figure supplement 1D.
Figure 4—figure supplement 1—source data 2. Statistical test results for Figure 4—figure supplement 1D.