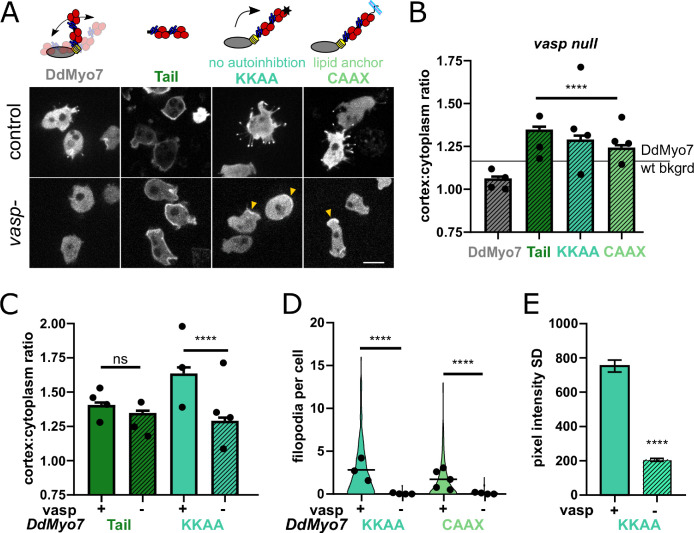
Figure 6. VASP-mediated actin assembly relieves DdMyo7 head-tail autoinhibition to promote targeting and filopodia formation.
(A) (top) Diagrams depicting mutants analyzed. (bottom) Micrographs of GFP-DdMyo7 fusion proteins in control and vasp null cells, scale bar is 10 μm. Arrows indicate cortical enrichment of DdMyo7. (B) Quantification of cortical recruitment of GFP-DdMyo7 and variants in vasp null cells (see also Table 2 and Figure 6—source data 1). The line represents the mean GFP-DdMyo7 recruitment in wild type cells. (C) Comparison of cortical targeting of activated DdMyo7-KKAA or tail in vasp null versus control cells (see also Figure 6—source data 1 and 2). (D) Quantification of number of filopodia per cell in control or vasp null cells (see also Table 2; Figure 6—source data 3). (B–D) Circles represent experimental means. One way ANOVA with multiple comparison test, ns not significant, p***<0.001, p****<0.0001, ns, not significant (see also Figure 6—source data 2 and 4). (E) Quantification of the cortical band intensity variation of DdMyo7-KKAA in control versus vasp null cells (see also Figure 6—source data 5). Students t-test ****p<0.0001.

