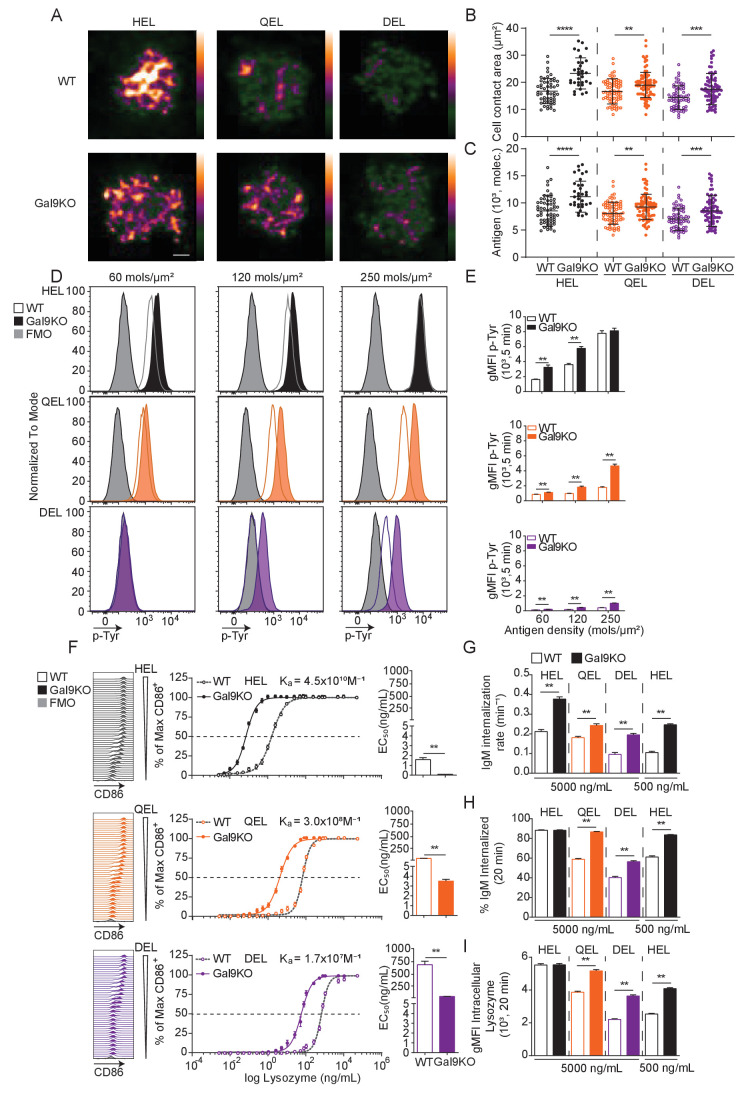
Figure 2. Gal9KO B cells respond more readily to low-affinity antigens.
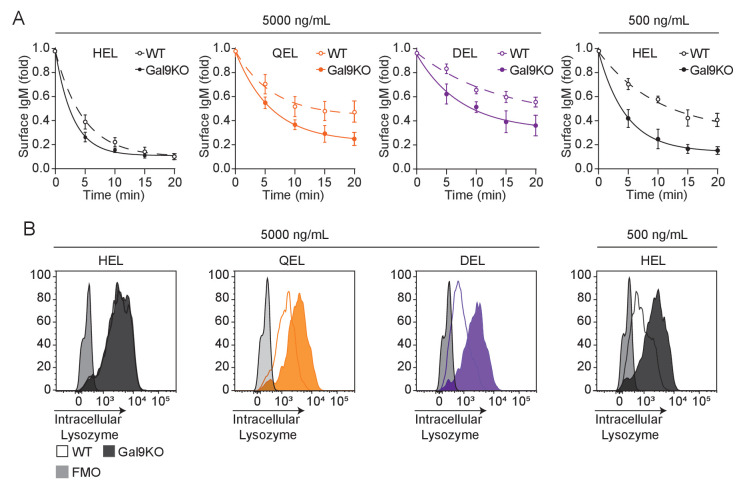
(A) Representative images of primary WT and Gal9KO B cells fixed on planar lipid bilayers containing fluorescently conjugated antigen, as indicated, after 90 s of spreading and imaged by TIRF microscopy. Images mapped to a blue-orange ice 8-bit color scale (ImageJ). Scale bar 2 μm. (B) Quantification of cell contact area of WT (open) and Gal9KO (filled) in response to planar lipid bilayers containing HEL (black), QEL (orange), and DEL (purple) antigens. (C) Quantification of the amount of accumulated antigen as in (B). (D) Representative histograms of total tyrosine phosphorylation (p-Tyr) in WT (open) and Gal9KO (filled) B cells stimulated for 5 min with indicated antigen deposited on OP9 stromal cells, as indicated. FMO (gray shaded). (E) Summary gMFI of data shown in (D). (F) Representative histograms of CD86 expression on WT (open) and Gal9KO (filled) B cells stimulated with increasing concentrations of lysozymes, as indicated (left). Summary statistic, proportion of CD86 expressing B cells (middle). EC50 of lysozyme titration (right). (G) Internalization rate (k) of IgM; (H) Proportion of total IgM internalized; and (I) gMFI of intracellular lysozyme expression for WT (open) and Gal9KO (filled) B cells following 20 min stimulation with lysozyme, as indicated. Data show mean ± SEM and are representative of nine biological replicates over three independent experiments. Statistical significance was assessed by Mann–Whitney **p≤0.01, ***p≤0.001, **** p<0.0001.


