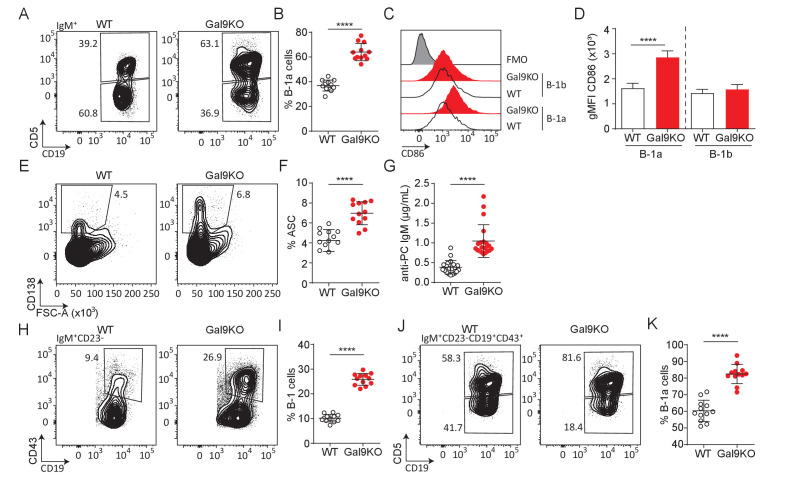
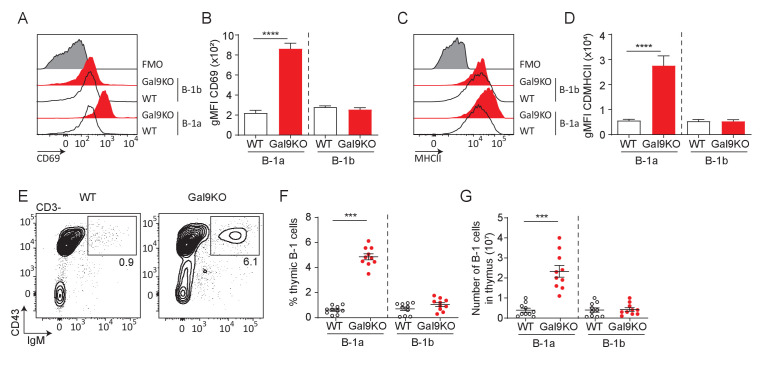
Figure 4. Loss of Gal9 leads to enhanced activation and accumulation of B-1a cells at steady-state.
(A) Representative plots of IgM expressing cells in the PerC of aged WT and Gal9KO mice, as indicated. (B) Summary proportion of CD5 expressing B-1a cells in the PerC shown in A. (C) Representative histograms of CD86 expression at steady state on PerC cells shown in (A). (D) Summary gMFI of CD86 expression shown in C. (E) Representative plots of ASCs in the PerC of aged mice. (F) Summary proportion of ASCs shown in (E). (G) Anti-phosphorylcholine (PC) specific IgM in sera of aged mice. (H) Representative plots of B-1 cells of IgM expressing cells in the spleen of aged mice. (I) Proportion of B-1 cells shown in H. (J) Representative plots of B-1a and B-1b cells of H. (K) Summary proportion of CD5 expressing B-1a cells in the spleen of aged mice shown in (I). Data are representative of ten biological replicates over three independent experiments. Statistical significance was assessed by Mann–Whitney ****p<0.0001.


