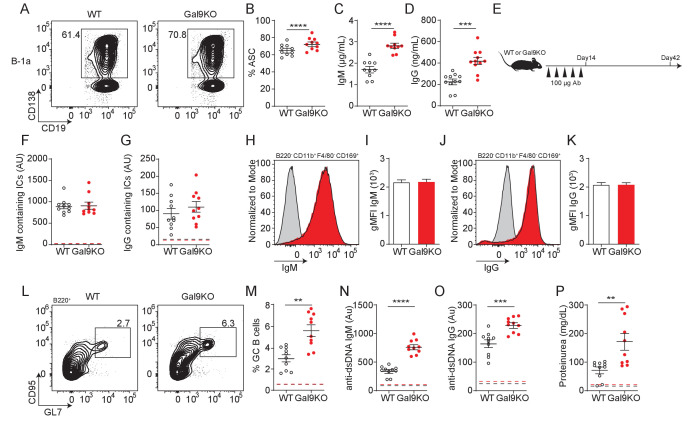
Figure 7. Transfer of B-1a derived antibodies leads to autoimmunity in mice.
(A) Representative plots of ASC development in sorted WT and Gal9KO B-1a cells cultured for 3 days in presence of 0.5 µg/mL LPS and 0.5 µg/mL IgM. (B) Summary proportion of ASC differentiation in sorted WT (black, open) and Gal9KO (red, filled), as in (A). (C) Secreted IgM titers, and (D) Secreted IgG titers in the culture supernatant, as in (A). (E) Schematic of in vivo B-1-derived antibody transfer experiment. (F) Titers of IgM and (G) IgG-containing ICs in circulation at day 14, mean baseline titers shown as dashed line. (H) Representative histograms and (I) summary gMFI of IgM expression on splenic subcapsular sinus macrophages at day 14. (J) Representative histograms and (K) summary gMFI of IgG expression on splenic subcapsular sinus macrophages at day 14. (L) Representative plots and (M) summary proportion of GC B cell differentiation in the spleen at day 42, mean baseline frequency shown as dashed lines. (N) Titers of dsDNA-specific IgM and (O) IgG in sera at day 42, mean baseline titers shown as dashed line. (P) Protein secretion in the urine of mice at day 42, mean baseline level shown as dashed line. Data are representative of 10 biological replicates over two independent experiments. Statistical significance was assessed by Mann–Whitney, *p≤0.05, **p≤0.01, ***p≤0.001, ****p<0.0001.


