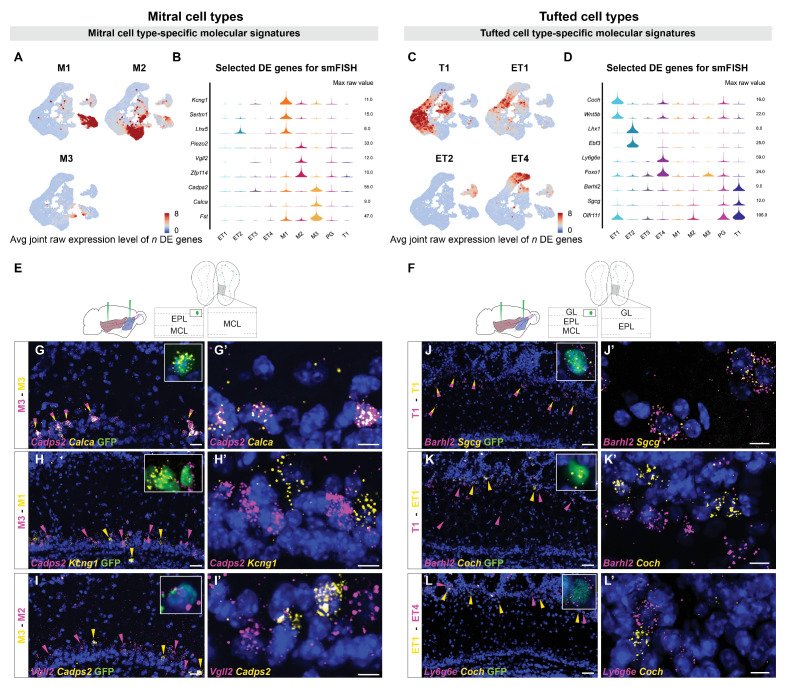
Figure 3. Histological validation of molecularly distinct mitral and tufted cell types.
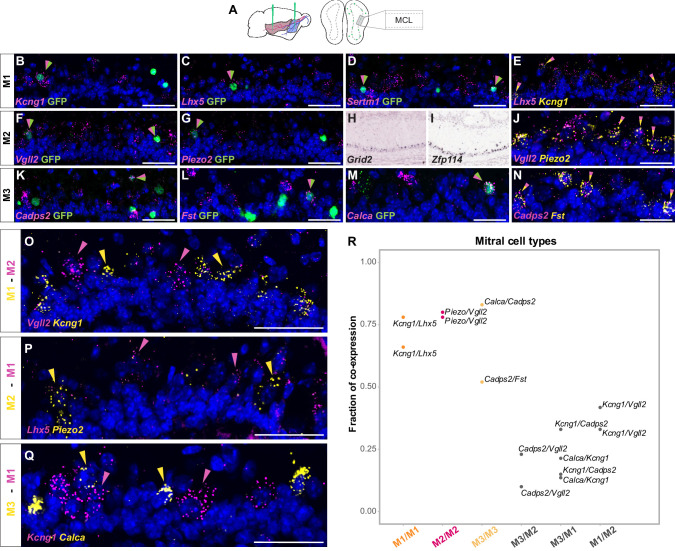
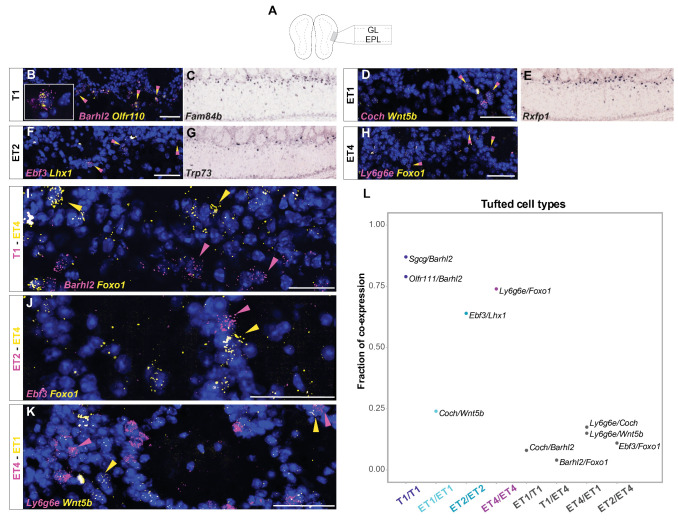
(A) Combined average (avg) raw expression level of the top n differentially expressed (DE) genes for each mitral cell type (M1 n=14, M2 n=11, M3 n=10), overlaid onto the subclustering UMAP space (shown in Figure 2D). DE genes were selected if their log fold change was greater than 4 (see Materials and methods for details). M1-specific genes: Kcng1, Lhx5, Sertm1, Gabra2, Doc2b, Cntn6, Olfr1259, Nrp2, C1ql1, Ebf1, Baiap3, Adgrl2, Dsc2, Chrna5; M2-specific genes: Piezo2, Vgll2, Zfp114, Nts, Ros1, Samsn1, Grid2, Smpx, Itga4, Itga9, Sema6d; M3-specific genes: Cadps2, Calca, Fst, Ets1, Ednra, Cdkn1c, Mustn1, Smoc2, Cnr1, Ccno. (B) Violin plots showing maximum raw expression value of selected mitral cell type-specific DE genes across mitral and tufted cell clusters for further validation with smFISH. (C) Combined average (avg) raw expression level of the top n DE genes for each tufted cell type (T1 n=9, ET1 n=7, ET2 n=9, ET4 n=6), overlaid onto the subclustering UMAP space (shown in Figure 2D). T1-specific genes: Barhl2, Sgcg, Vdr, Olfr111, Olfr110, Cacna1g, Fam84b, Kcna10, Tspan10; ET1-specific genes: Coch, Wnt5b, Rorb, Chst9, Tpbgl, Clcf1, Rxfp1; ET2-specific genes: Lhx1, Ebf3, Trp73, Edn1, Ebf2, Nr2f2, Uncx, Psrc1, Dsp; ET4-specific genes: Ly6g6e, Foxo1, Siah3, Galnt12, Itga8, Ets2, Grik4. (D) Violin plots showing maximum raw expression value of selected tufted cell type-specific DE genes across mitral and tufted cell clusters for further validation with smFISH. (E, F) Schematic representations of the smFISH images for validating projection neuron type-specific marker genes upon rAAVretro-CAG-H1B-GFP injection into PCx and AON. The schemes depict the laminar location visualized in the histological images from a coronal section of the ipsilateral hemisphere to the injection site. EPL: external plexiform layer; MCL: mitral cell layer; GL: glomerular layer. (G–I) smFISH showing combinatorial expression of mitral cell type-specific marker genes for M1, M2 and M3 cells in the mitral cell layer. High magnifications (top right) show co-labeling of viral GFP with the in situ mRNA probe. (G and G’). The M3 markers Cadps2 and Calca are co-expressed in subpopulations of cells in the mitral cell layer, indicated by the yellow/magenta arrowheads. (H and H’) The M3 marker Cadps2 and M1 marker Kcng1 are expressed in distinct subpopulations of cells in the mitral cell layer, indicated by the magenta and yellow arrowheads respectively. (I and I’) The M3 marker Cadps2 and M2 marker Vgll2 are mutually exclusive in subpopulations of cells in the mitral cell layer, indicated by the yellow and magenta arrowheads respectively. For additional histological analysis and quantification of co-expression see Figure 3—figure supplement 1. (J–L) smFISH images showing combinatorial expression patterns of tufted cell type-specific marker genes for validating T1, ET1, ET2 and ET4 clusters as distinct projection neuron types in the external plexiform and glomerular layers. High magnifications (top right) show co-labeling of viral GFP with the in situ mRNA probe. As described for the mitral cell types, yellow or magenta arrowheads show non-overlapping patterns (K, K’: T1–ET1 and L, L’: ET1–ET4), and yellow/magenta arrowheads show co-expression patterns (J, J’: T1–T1). For additional histological analysis and quantification of co-expression see Figure 3—figure supplement 1. DAPI counterstain in blue. Scale bars, 50 μm and 10 μm (high magnifications).


