. 2021 Jul 22;10:e65445. doi: 10.7554/eLife.65445

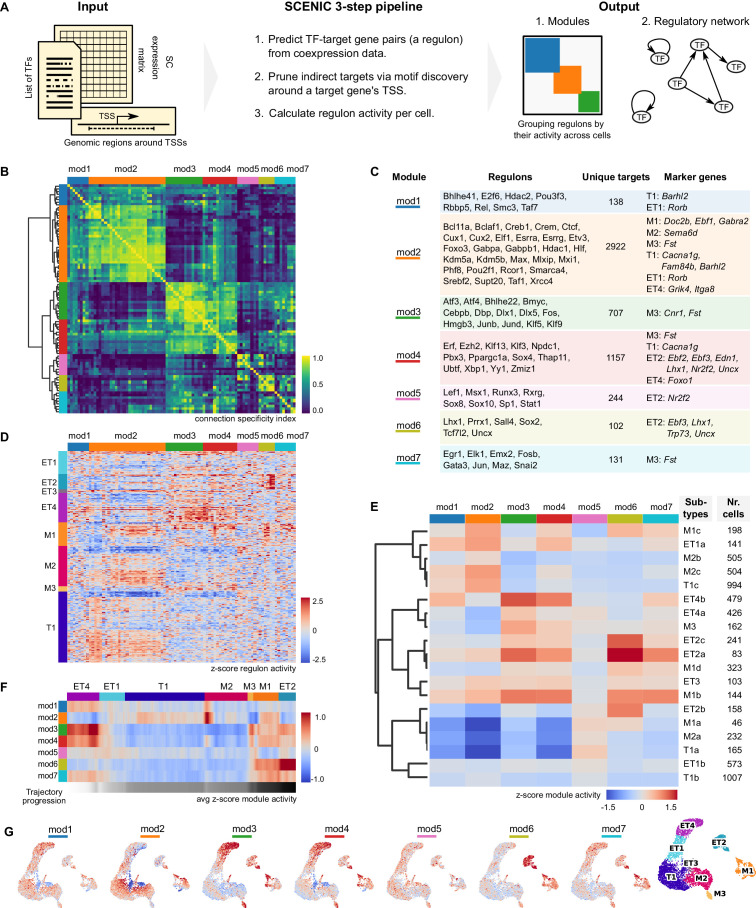
Figure 4. Mitral and tufted cell-specific regulons combine into modules.

(A) Schematic representation of the network analysis pipeline, including the required input, the SCENIC protocol, and the output in the form of regulon modules and a regulatory network (in Figure 5). TSS: transcription start site; TF: transcription factor. (B) Hierarchical clustering of mitral and tufted cell-specific regulons using the Connection Specificity Index (CSI) as a distance measure results in seven modules (Ward linkage). The connection specificity index compares Pearson correlation coefficients (PCC) between regulons. If we take regulons A and B, their CSI is the number of PCC of A with other regulons and of B with other regulons that are lower than the PCC between A and B. This means that the CSI contextualizes a correlation between two regulons given how these regulons correlate to the rest. Prominent cross-module interactions are observed for mod1–2, mod3–4, and mod6–7. Module four showed interactions with all other modules. (C) Table listing the mitral and tufted cell-specific modules, their regulons, the number of unique target genes in each module, and cluster-specific marker genes found also as target genes in a given module. Marker genes were established by transcriptome analysis and shown in Figure 3B and D. (D) Regulon activity (columns) in mitral and tufted cell types (rows) defines subtypes within each cluster. Within each cell type, rows were ordered by hierarchical clustering (correlation distance, complete linkage). Columns clustered as in (B). (E) Module activity per cell subtype. Module activity is calculated as the average activity of its regulons for a given cell subtype. Rows were ordered by hierarchical clustering (correlation distance, complete linkage). Each cell subtype may be defined by a combination of active and inactive modules. For example, M2b and M2c are defined by relatively high activity in modules 1 and 2. (F) Quantification of changes in module activity through trajectory analysis. A single trajectory that traverses the cell types in the order ET4, ET1, T1, M2, M3, M1, ET2, is computed using PAGA (Wolf et al., 2019). Module activity along the trajectory is the average over a sliding window of 100 nuclei. Trajectory progression is depicted as a greyscale gradient from white to black. Along the same trajectory is also computed the regulon activity and expression levels of the corresponding TFs (Figure 4—figure supplement 3). (G) Module activity mapped on the projection neuron UMAP space (Figure 2D, rightmost UMAP for convenience). Color range as in (E).

Figure 4.

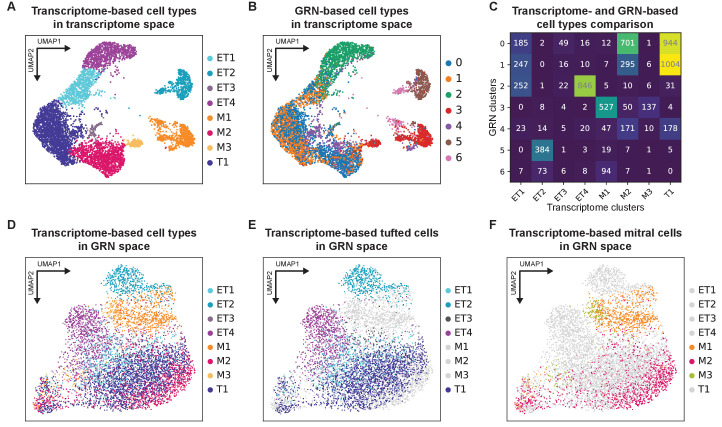
Figure 4—figure supplement 1. Comparing transcriptomic and gene regulatory network-defined mitral and tufted cell types.

Figure 4—figure supplement 1.

(A) Transcriptome-defined mitral and tufted cell types in transcriptome-based UMAP space (Figure 2D) shown here for comparison with (B). PG cluster was not used in the pySCENIC gene regulatory network (GRN) analysis and therefore was removed from the plot. (B) GRN-based mitral and tufted cell types mapped onto the transcriptome-defined UMAP space. The numbers shown on the right (1–6) are the pySCENIC clusters. (C) Quantification of the comparison between transcriptomic and GRN-based mitral and tufted cell types. The Adjusted Rand Index (ARI) = 0.326 indicates differences between the two types of clustering analysis. (D) Transcriptome-defined mitral and tufted cell types in GRN-based UMAP space. Clusters are restricted to specific, yet overlapping, regions of the GRN-based UMAP. (E) Same as (D), but only tufted cell types are visualized. (F) Same as (D), but only mitral cell types are visualized.
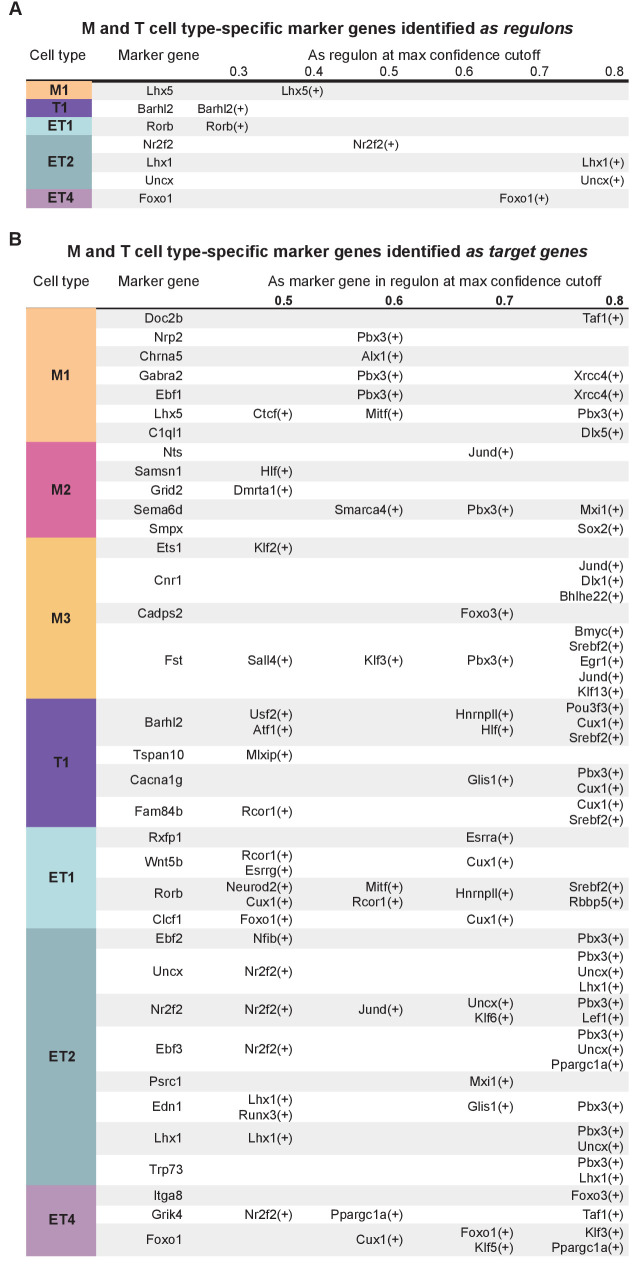
Figure 4—figure supplement 2. Mitral and tufted cell type-specific marker genes found in regulons.

Figure 4—figure supplement 2.

(A) Mitral and tufted cell type-specific marker genes identified as regulons in pySCENIC analysis. Columns from left to right: cluster membership; marker gene; marker gene as regulon with its max confidence cut-off. Regulons with a confidence cut-off ≥0.3 are shown. (B) Presence of mitral and tufted cell type-specific marker genes as target genes in pySCENIC analysis. Columns from left to right: cluster membership; marker gene; presence in regulon(s) at the corresponding highest confidence cut-offs. Regulons with a confidence cut-off ≥ 0.5 are shown.
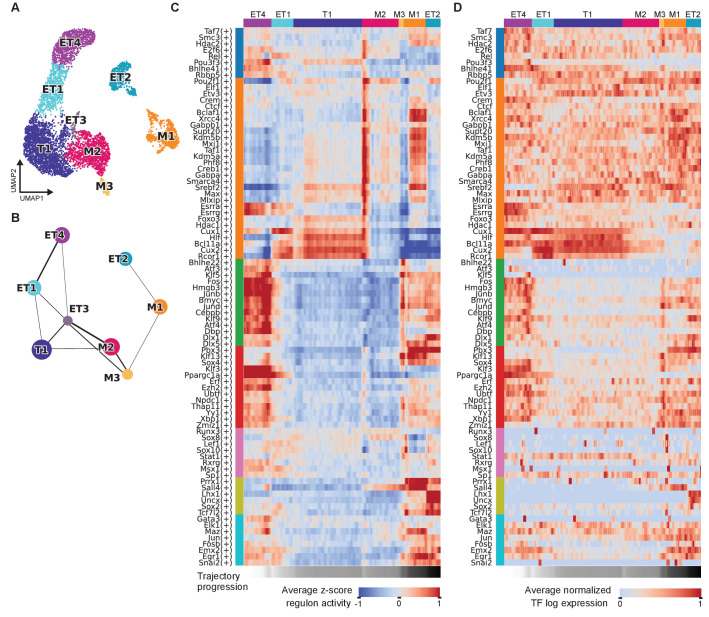
Figure 4—figure supplement 3. PAGA-based trajectory analysis of mitral and tufted cell types.

Figure 4—figure supplement 3.

(A) Recomputed transcriptome-based UMAP with the PG cluster removed from the data. (B) The PAGA graph derived from the clustering in (A). (C) Average regulon activity along the trajectory ET4, ET1, T1, M2, M3, M1, ET2. Regulons are grouped by the module membership as indicated by the vertical color-coded bars. The trajectory is averaged with a sliding window of size 100 nuclei. (D) Average transcription factor expression levels along the trajectory ET4, ET1, T1, M2, M3, M1, ET2 as in (C). Each row corresponds to the TF of the regulon as shown in (C). Log expression levels are normalized to the interval [0, 1]. The trajectory is averaged with a sliding window of size 100 nuclei.