. 2021 Jul 22;10:e65445. doi: 10.7554/eLife.65445

Figure 5. Mitral and tufted cell-specific transcription factor network derived from regulons.

(A) Overview of mitral and tufted cell-specific transcription factor (TF) network, with node size scaled by the number of target genes and nodes colored with different shades of gray based on the outdegree (number of outgoing edges). Thick borders and edges denote cycles of 2 or three regulons. The three main hubs are: Pbx3 (outdegree 17, target genes 545), Bmyc (outdegree 11, target genes 523) and Taf1 (outdegree 9, target genes 551). (B) Same network as shown in A specific for mitral cell types (M1, M2, M3) with standardized regulon activity for the top 10 most specific regulons mapped onto the corresponding TF nodes (compare Figure 4D,E). Regulon specificity scores are shown in Figure 5—figure supplement 1A, with expression of the corresponding TFs visualized on UMAPs in Figure 5—figure supplement 1B. Mitral and tufted cell type-specific marker genes are visualized in the network in Figure 5—figure supplement 2. (C) Same network as shown in (A) specific for tufted cell types (T1, ET1, ET2, ET4) with standardized regulon activity for the top 10 most specific regulons. We omitted ET3 as it only has a few nuclei. As for mitral cell types, see also Figure 5—figure supplements 1 and 2.

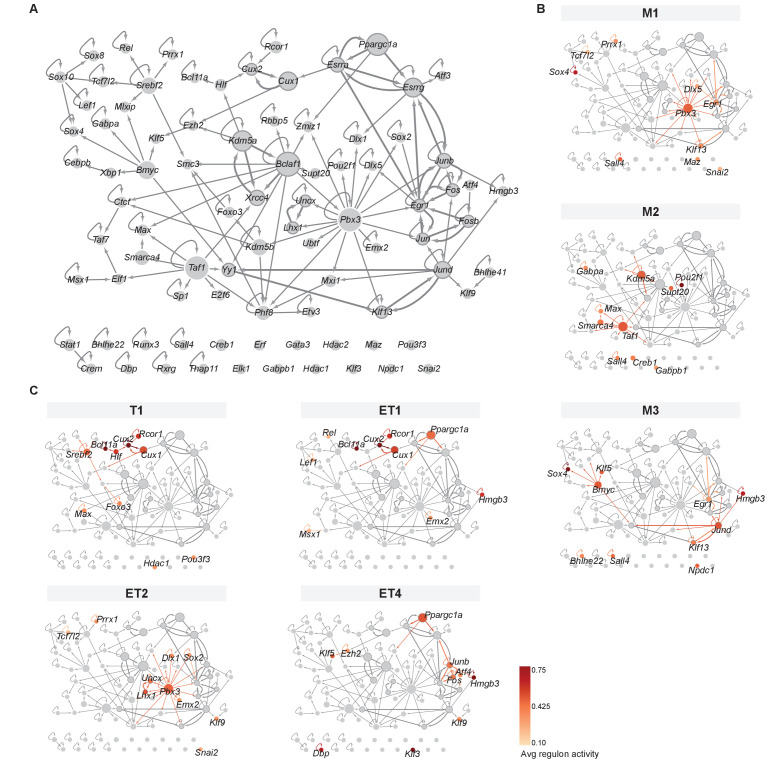
Figure 5.

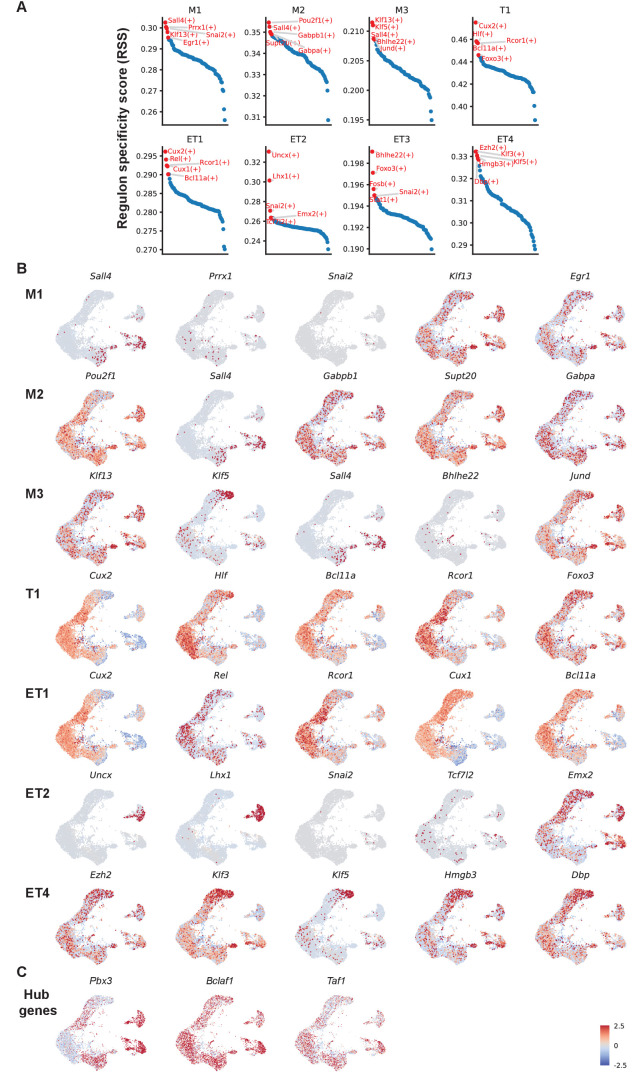
Figure 5—figure supplement 1. Top five mitral and tufted cell type-specific regulons.

Figure 5—figure supplement 1.

(A) Regulon specificity score for each cell type, with the top five highest scoring regulons shown in red. Specificity scores are based on Jensen-Shannon Divergence, a metric for comparing probability distributions (Suo et al., 2018). pySCENIC provides standard functionality to compute the scores. (B) UMAP representations of the top five mitral and tufted cell type-specific regulons (transcription factors) organized in rows by the cluster membership. Z-scored expression levels are used to highlight relative differences between cell types. Four TFs, namely Prrx1, Snai2, Bhlhe22, and Tcf7l2, are only very sparsely expressed (confirmed by the raw expression levels, data not shown). Their cell-type specificity has to be interpreted with caution. (C) UMAP representations of the top three network hub genes (Pbx3, Bclaf1, and Taf1). Pbx3 is predominantly expressed in mitral cell type M1 and tufted cell type ET2. Bclaf1 and Taf1 are more broadly expressed across all M/T cell types. Nuclei are color-coded by the raw expression level of transcripts.
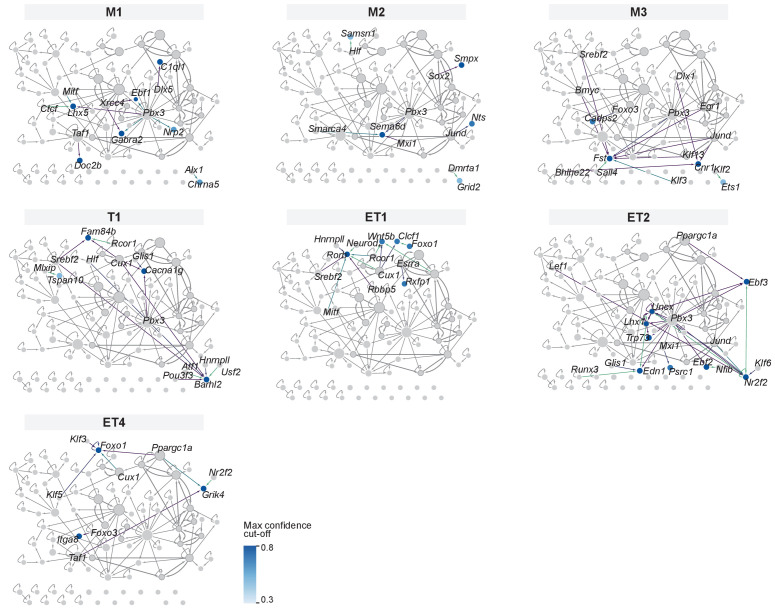
Figure 5—figure supplement 2. Mitral and tufted cell type-specific marker genes visualized as target genes in the gene regulatory network.

Figure 5—figure supplement 2.

For each mitral and tufted cell type, marker genes are integrated in the gene regulatory network (network shown in Figure 5), with nodes and interactions colored by the highest confidence cut-off that would keep the marker gene in the regulon dataset. Results based on a confidence cut-off ≥0.3 are included, consistent with Figure 4—figure supplement 2.