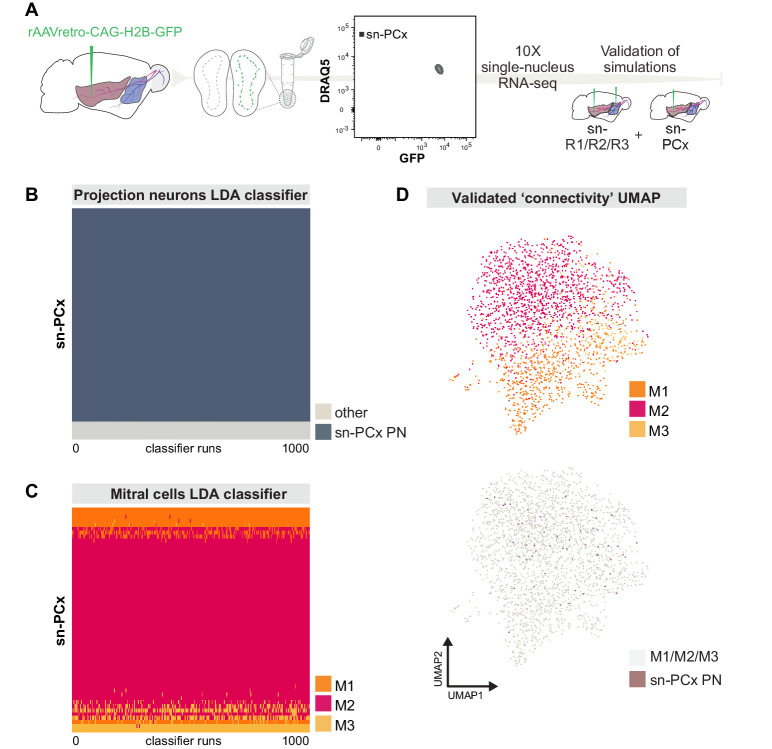
Figure 7. Targeted snRNA-seq experiment validates simulation-based predictions of molecularly defined-mitral cell types with distinct projection targets.
(A) Schematic representation of experimental design. Top: after injection of rAAVretro-CAG-H2B-GFP into PCx, single nuclei were dissociated from one mouse and sorted using Fluorescence-activated Nuclei Sorting (FANS). The population of nuclei is selected based on GFP and DRAQ5 (far-red fluorescent DNA dye). Sorted nuclei were sequenced using 10x single-nucleus RNA-seq and integrated with the main sn-R1/R2/R3 dataset. (B) Linear discriminant analysis (LDA) classifiers were trained on the main sn-R1/R2/R3 dataset, then used to predict the projection neuron identity of sn-PCx cells. Each row represents one cell in the new, targeted sn-PCx data. Each column represents one of 1000 LDA classifiers trained to discriminate projection neurons from other cell types. The color indicates the prediction made by each classifier (dark: projection neuron, light: other). (C) LDA classifiers were trained on the main dataset sn-R1/R2/R3, then used to predict the cell type identity of sn-PCx projection neurons. Each row represents one sn-PCx projection neuron. Each column represents one of 1000 LDA classifiers trained to predict cell type identity based on regulon expression. Color indicates the predicted cell type identity (orange: M1, red: M2, yellow: M3). (D) UMAP showing sn-R1/R2/R3 mitral cells and sn-PCx projection neurons integrated in the same low-dimensional space. UMAP was computed based on regulon expression. sn-PCx projection neurons are in purple, while sn-R1/R2/R3 mitral cells are in color according to their cell type identity (orange: M1, red: M2, yellow: M3) on the top UMAP, while in grey on the bottom (same) UMAP.

