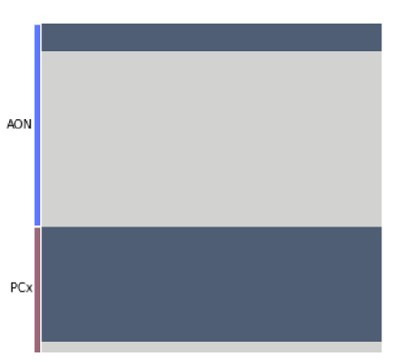
Author response image 2. Each row represents one cell in the new, targeted snRNA-seq data.

Each column represents one of 1000 linear discriminant analysis (LDA) classifiers trained to discriminate projection neurons from other cell types (analogously to the analysis in the original manuscript Figure 7B). The color indicates the prediction made by each classifier (dark: projection neuron, light: rest).
