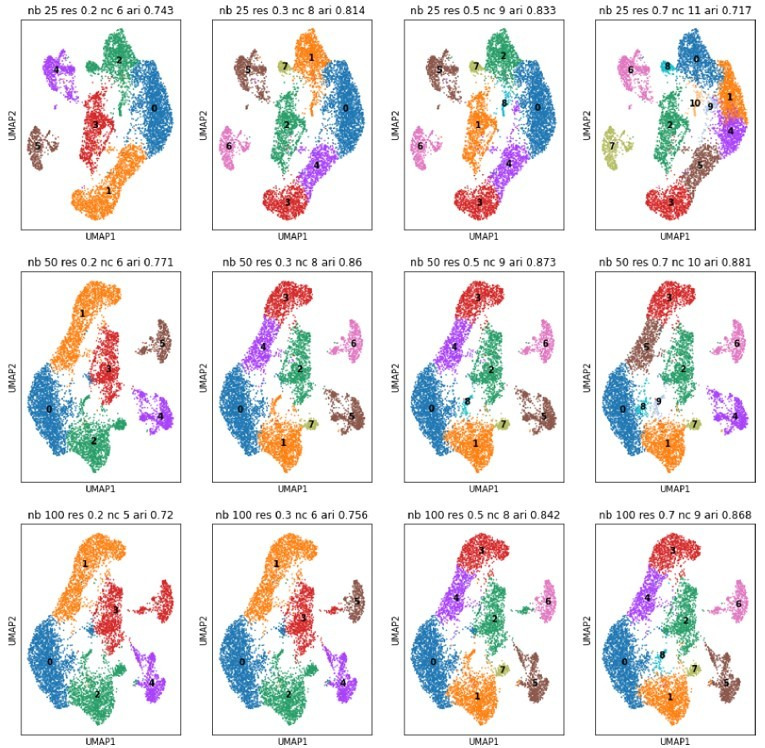
Author response image 8. UMAPs for different numbers of neighbors (nb, rows) and different Louvain resolutions (res, columns).

Neighbors are taken at 25, 50 and 100; resolutions at 0.2, 0.3, 0.5, and 0.7. We recomputed the PCA space of the projection neuron subcluster and consequently the displayed clustering is slightly different from the one in the original manuscript (See also comment 38). ‘nc’ stands for number of detected clusters, ‘ari’ is the adjusted rand index in comparison to the clustering of the original manuscript.
