Figure 7.

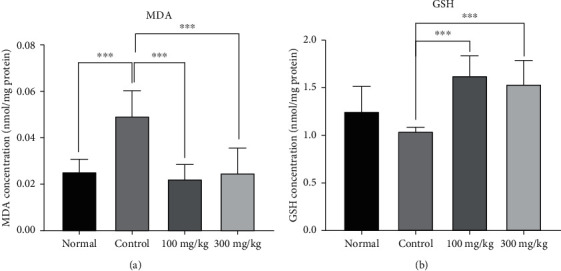
The effects of different doses of PO on the peritoneal lavage levels of (a) MDA and (b) GSH; data were presented as mean ± SD (n = 8 for all groups except normal as 6). ∗∗P < 0.01 and ∗∗∗P < 0.001.

The effects of different doses of PO on the peritoneal lavage levels of (a) MDA and (b) GSH; data were presented as mean ± SD (n = 8 for all groups except normal as 6). ∗∗P < 0.01 and ∗∗∗P < 0.001.