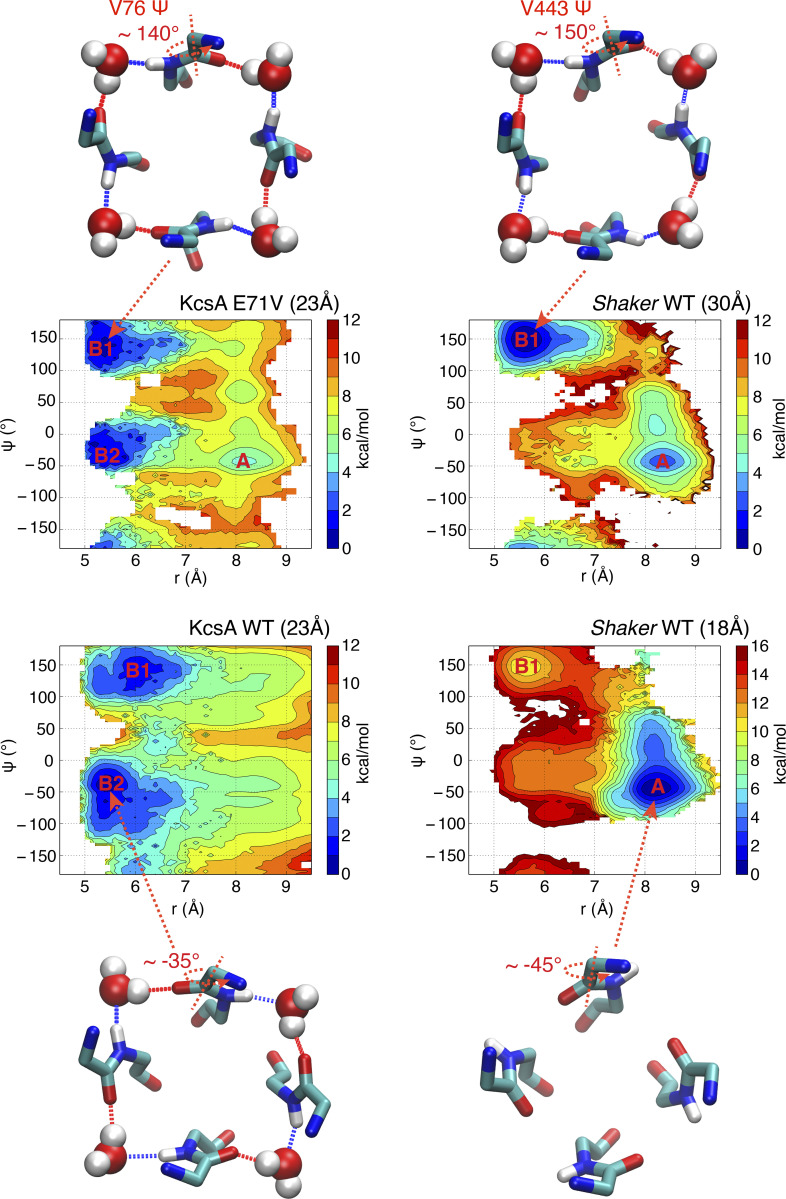
Figure 6.
2-D–PMF to assess the conformational preferences of different constricted structures. The horizontal reaction coordinate r describes the width of the selectivity filter and is defined as the average cross-subunit pinching distance between the Cα–Cα atoms of G444 in Shaker or G77 in KcsA. The vertical reaction coordinate Ψ indicates the backbone Ψ dihedral angle of the valine in the center of the selectivity filter. The typical conformations for free energy basins are shown in stick for protein and van der Waals representation for water molecules from the top view.

