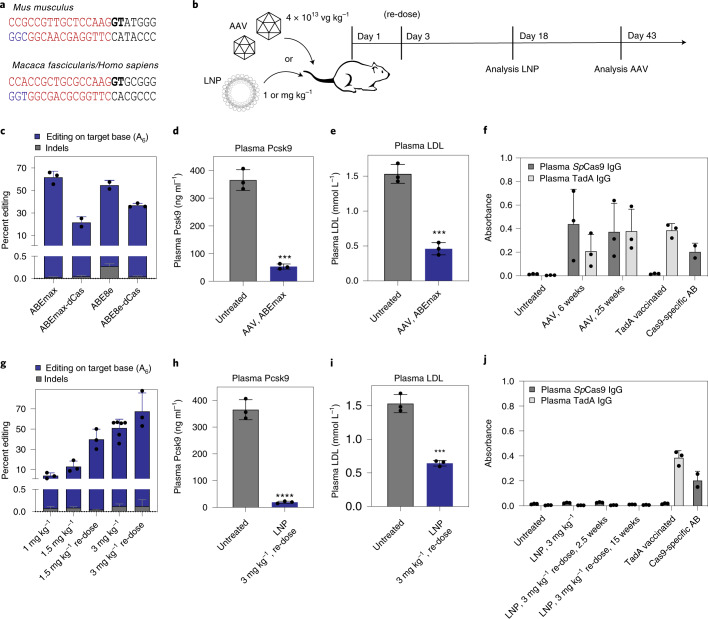
Fig. 1. In vivo adenine base editing of the Pcsk9 locus in the mouse liver.
a, sgRNA target sequences in the mouse and macaque/human PCSK9 gene. The exonic region (exon 1) is highlighted in red; the intronic region is highlighted in black. The GT splice donor recognition site is highlighted in bold letters. The NGG-PAM site is indicated in blue. b, Schematic outline of the mouse experiments. Vectors were administered intravenously via tail vein injection in adult C57BL/6J mice. c, Percent editing after treatment with different ABE variants. Insertions and deletions are summarized as ‘Indels’. Values represent mean ± s.d. of n = 3, n = 2, n = 2 and n = 3 animals. d, Plasma Pcsk9 protein levels as determined by ELISA. ***P = 0.0002. e, Plasma LDL cholesterol levels. ***P = 0.0003. f, Background-subtracted absorbance (A450 – A540) representing the relative amount of anti-Cas9- or anti-TadA-specific plasma IgG antibodies as determined by ELISA. Positive control: plasma of TadA vaccinated animals or commercial Cas9-specific antibody at a concentration of 200 ng ml−1 (n = 2). g, Percent editing after treatment with different doses of LNP-encapsulated mRNA/sgRNA. Insertions or deletions are summarized as ‘Indels’. h, Plasma Pcsk9 protein levels as determined by ELISA. ****P < 0.0001. i, Plasma LDL cholesterol levels. ***P = 0.0004. j, Background-subtracted absorbance (A450 – A540) representing the relative amount of anti-Cas9- or anti-TadA-specific plasma antibodies as determined by ELISA. Positive control: plasma of TadA vaccinated animals or commercial Cas9-specific antibody at a concentration of 200 ng ml−1 (n = 2). Unless otherwise stated, values represent mean ± s.d. of n = 3 animals. Means were compared using two-tailed unpaired t-tests. vg, vector genomes.

