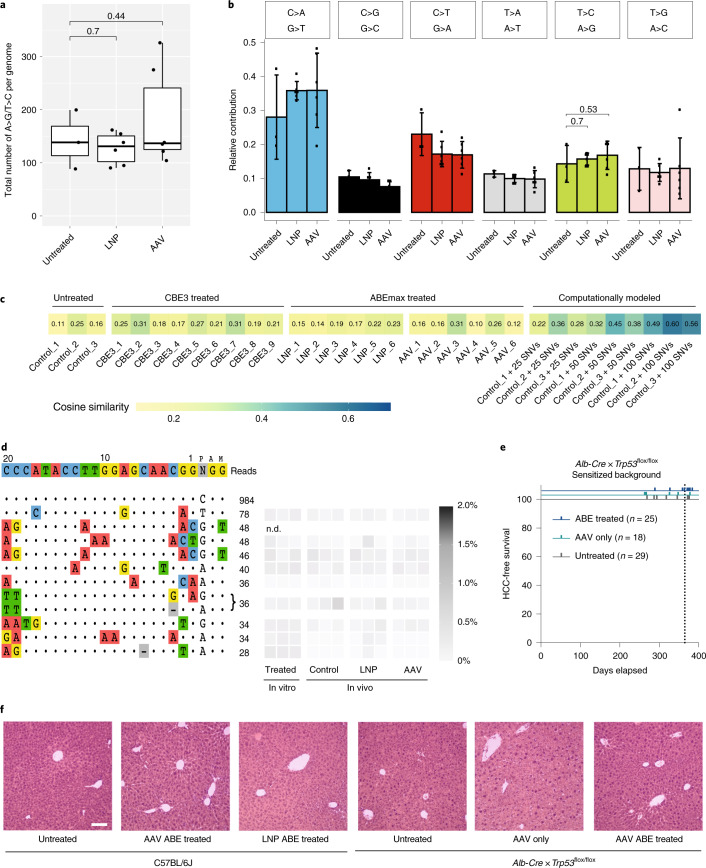
Fig. 3. In vivo adenine base editing of Pcsk9 does not induce substantial off-target mutations in DNA.
a, Total number of A-to-G (including T-to-C) edits per genome. Clones from untreated control (n = 3), LNP-treated (n = 6) and AAV-treated (n = 6) mice. Box plots are standard Tukey plots. The centerline represents the median; the lower and upper hinges represent the first and third quartiles; and the whiskers represent ±1.5× the interquartile range. Two-tailed unpaired t-tests were used to compare means. b, Relative contributions of single-base substitutions in clones shown in a. Values represent mean ± s.d. Two-tailed unpaired t-tests were used to compare means. c, Heat map showing the cosine similarity of mutational signatures of control clones (untreated and CBE-treated) and ABE-treated clones (LNP and AAV) to a predetermined TadA signature39. 1 (match) and 0 (no similarity). For details on the clones, see Supplementary Fig. 6. In positive control clones, a TadA-specific trinucleotide mutation pattern39 was computationally added. d, sgRNA-dependent off-target sites of sgRNA-mP01 identified by CIRCLE-seq. The top ten off-target sites were analyzed by NGS in Hepa1-6 cells 5 d after transfection with plasmids encoding ABEmax and sgRNA_mP01 (in vitro) and in primary hepatocytes isolated from LNP-treated mice (3 mg kg−1, re-dose), AAV-treated mice (ABEmax) and untreated C57BL/6J mice. The second off-target site could not be determined (n.d.) owing to repetitiveness of the locus. Values represent the highest A-to-G conversion frequency within the protospacer. n = 3 biological replicates per treatment. e, Alb-Cre × Trp53flox/flox mice treated with AAVs expressing ABEmax and sgRNA_mP01 5 weeks after birth. Depicted is the HCC-free survival of mice. n = number of animals per group. f, Histopathology of liver samples from wild-type C57BL/6J animals and Alb-Cre × Trp53flox/flox animals. C57BL/6J animals untreated (n = 3), treated with LNP (n = 3) or treated with AAV (n = 3) were analyzed after 18 or 25 weeks, respectively. Alb-Cre × Trp53flox/flox animals untreated (n = 28), treated with control AAV (C-terminal part of the split system and a non-targeting sgRNA) (n = 18) or treated with the PCSK9-targeting AAV (n = 25) were analyzed after 1 year. H&E staining was performed on all animals; three pictures per animal were taken. Representative images are shown. (H&E; scale bar, 50 µm).

