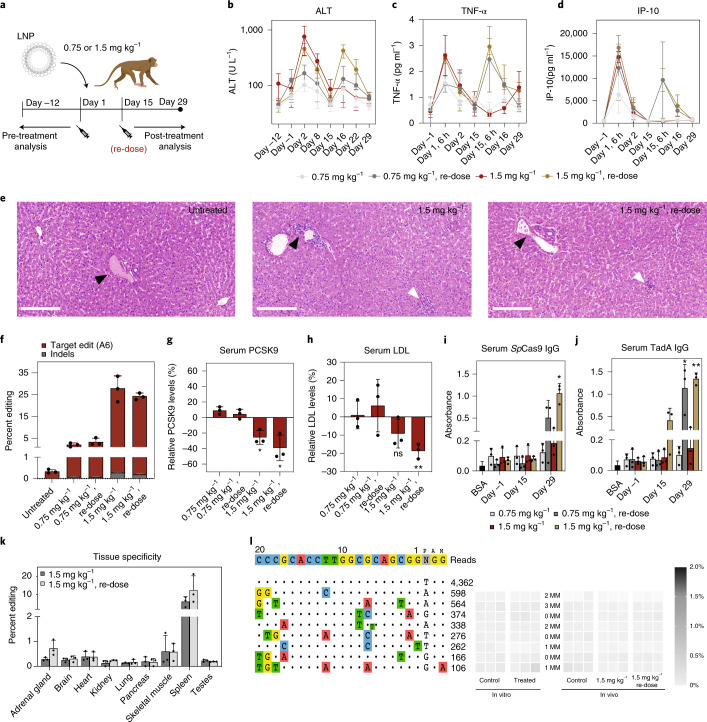
Fig. 4. In vivo adenine base editing of the PCSK9 locus in the liver of macaques.
a, Schematic outline of the experiments. Levels of ALT (b), TNF-α (b) and IP-10 (c). Day 15 is before re-dosing; Day 15, 6 h is 6 h after re-dosing. e, Histopathology of liver samples from untreated, 1.5 mg kg−1 single-dosed and 1.5 mg kg−1 re-dosed animals. Three different liver lobes of all animals of the high-dose groups were examined by a trained pathologist. Only very mild lobular mixed inflammatory cell infiltration was observed (white arrowhead). Black arrowheads indicate portal tracts. H&E; scale bar, 200 μm. f, Percent editing in treatment groups (six liver biopsies per animal analyzed). g, PCSK9 levels. Serum from two time points before (Day –12 and Day −1) and after (Day 22 and Day 29) treatment was analyzed. *P = 0.020 (1.5 mg kg−1); *P = 0.027 (1.5 mg kg−1 re-dose). h, LDL levels. Serum from two time points before (Day –12 and Day –1) and after (Day 22 and Day 29) treatment was analyzed. NS = 0.091; **P = 0.008. i, Background-subtracted absorbance (A450 – A540) representing the relative amount of anti-Cas9-specific IgG antibodies. 5% BSA coating was used to determine background levels. Means were compared to Day −1. *P = 0.0095. j, Background-subtracted absorbance (A450 – A540) representing the relative amount of anti-TadA-specific IgG antibodies. Means were compared to Day −1. *P = 0.0336, **P = 0.0026. k, Editing rates in DNA isolated from other tissues than the liver. l, sgRNA-dependent off-target sites of sgRNA_hP01 in the human genome identified using CIRCLE-seq. The top eight hits with orthologous sites in M. fasciularis were analyzed by NGS in vitro (HepG2 cells transfected with plasmids encoding ABEmax and sgRNA_hP01) and in vivo (3 mg kg−1 single-dosed and re-dosed). Values represent the highest A-to-G conversion frequency within the protospacer. n = 3 biological replicates per treatment. Control: DNA isolated from untreated HepG2 cells and macaque blood cells before treatment. MM, mismatches between the human and M. fasciularis genome. Values represent mean ± s.d. of n = 3 animals. Means were compared using one-tailed paired t-test.

