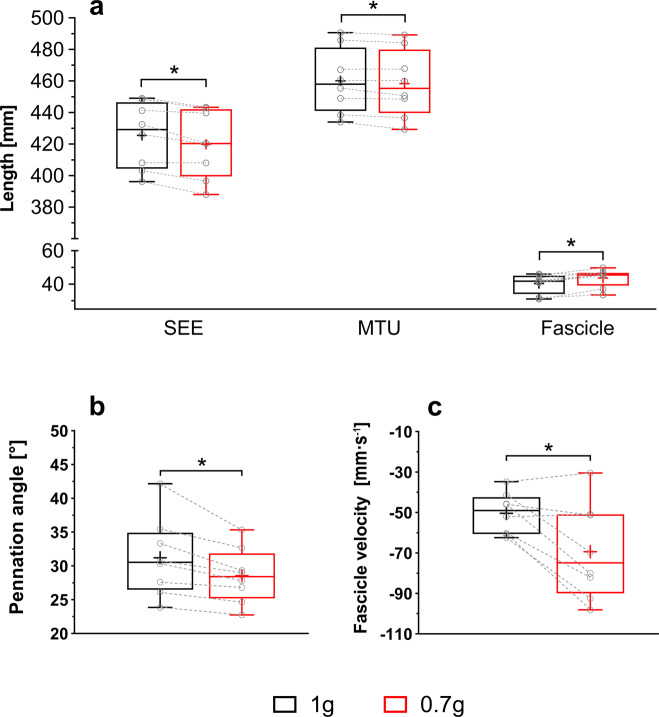
Fig. 2. GM fascicle‒SEE behavior at the time of peak SEE length when running at 1 g and simulated 0.7 g.
SEE length (a, left), MTU length (a, middle), fascicle length (a, right), pennation angle (b), and fascicle velocity (c) at the time of the peak SEE length differ between running at 1 g (black box) and simulated 0.7 g (red box). The lower and upper parts of the box represent the first and third quartile, respectively. The length of the whisker represents the minimum and maximum values. The horizontal line in the box represents the statistical median of the sample; + the mean of the sample; ○ individual data points; * significantly different (two-tailed paired t-test) from 1 g (P ≤ 0.05). n = 8 participants.

