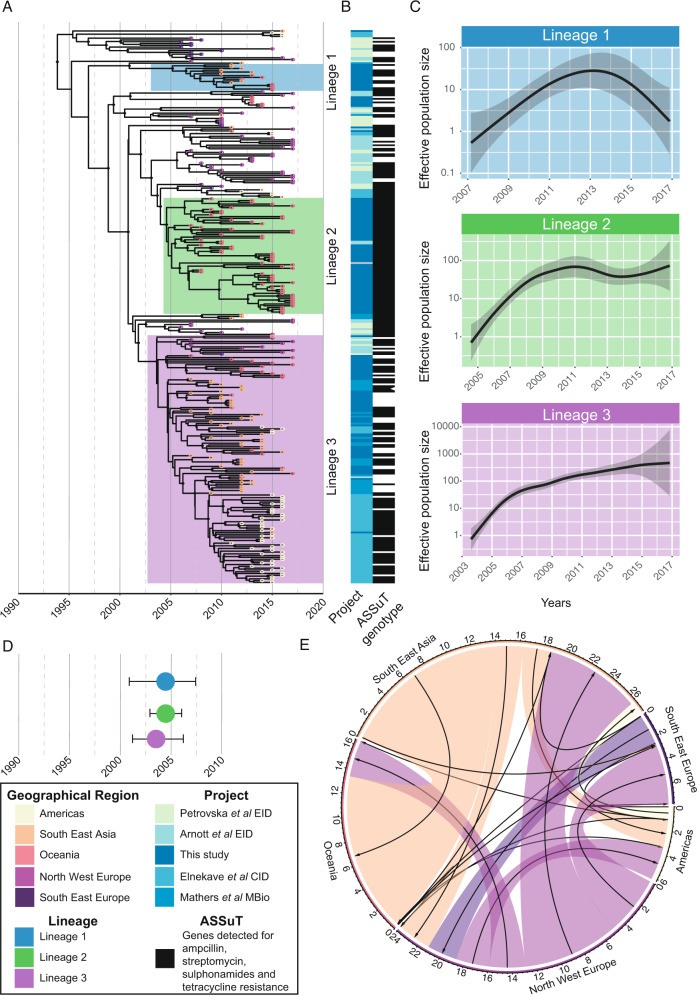
Fig. 1. Inferred population dynamics of ST34 Salmonella 4,[5],12:i:-.
A Bayesian evolutionary analysis showing the maximum-clade credibility (MCC) tree of ST34 isolates (n = 309) inferred from 2693 SNPs, demonstrating the timing of divergence and geographical spread of Salmonella 4,[5],12:i:- globally. The tips of the phylogeny are colored by the major geographical regions for the reported country of collection (for publicly available data) or by destination of reported travel (if any) for Australian isolates. The three lineages are highlighted on the phylogeny. The posterior support of ≥0.95 for internal nodes is shown with black circles on the node. The time in years is given on the x axis. Phylogeny available in Newick form from microreact (https://microreact.org/project/mfxxBchBsUpsJu7nvfkFw4). B Heatmap that shows the study from which the isolates were sourced and the presence of the ASSuT genotype (defined by any genes mediating antimicrobial resistance to ampicillin, streptomycin, sulfonamides, and tetracycline). C The estimated effective population size through time for each of the three lineages. The shaded area indicates the 95% confidence interval. D Visualization of the most recent common ancestor (MRCA) of the three lineages with highest posterior density (HPD) intervals shown as the bars. E Circular migration diagram of the migration events between the five geographical regions. The size of the colored block denotes the posterior mean number of inferred migration events from the Bayesian phylogeographical analysis and arrows denote directionality. The inset box is the legend for the different attributes.

