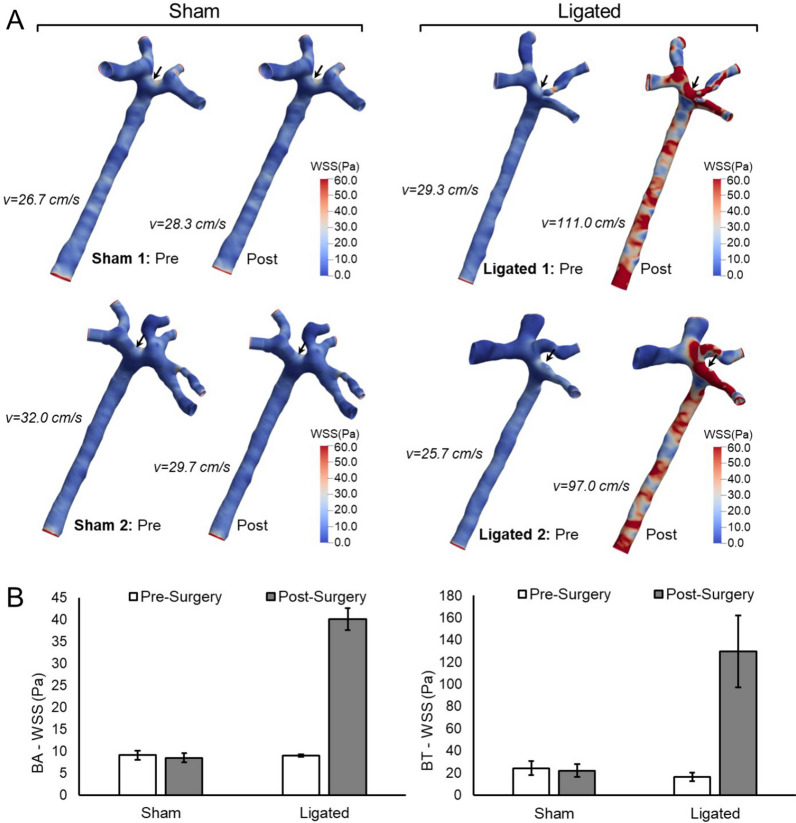
Figure 1.
WSS at the BA and BT before and after carotid ligation. (A) 3D renderings showing the distribution of WSS at the luminal surface of the BA and BT. WSS was calculated by CFD as described in Materials and Methods based on the indicated flow rates, which were measured by TCD sonography. (B) Average WSS values are shown for each location and condition. WSS in the BA was averaged over the length of the vessel, the value for the BT was averaged over the vessel surface within a 1 mm diameter sphere centered at the apex of the bifurcation (arrow). WSS is higher at the BT than the BA, and is increased at both locations after ligation, while sham surgery had no effect.

