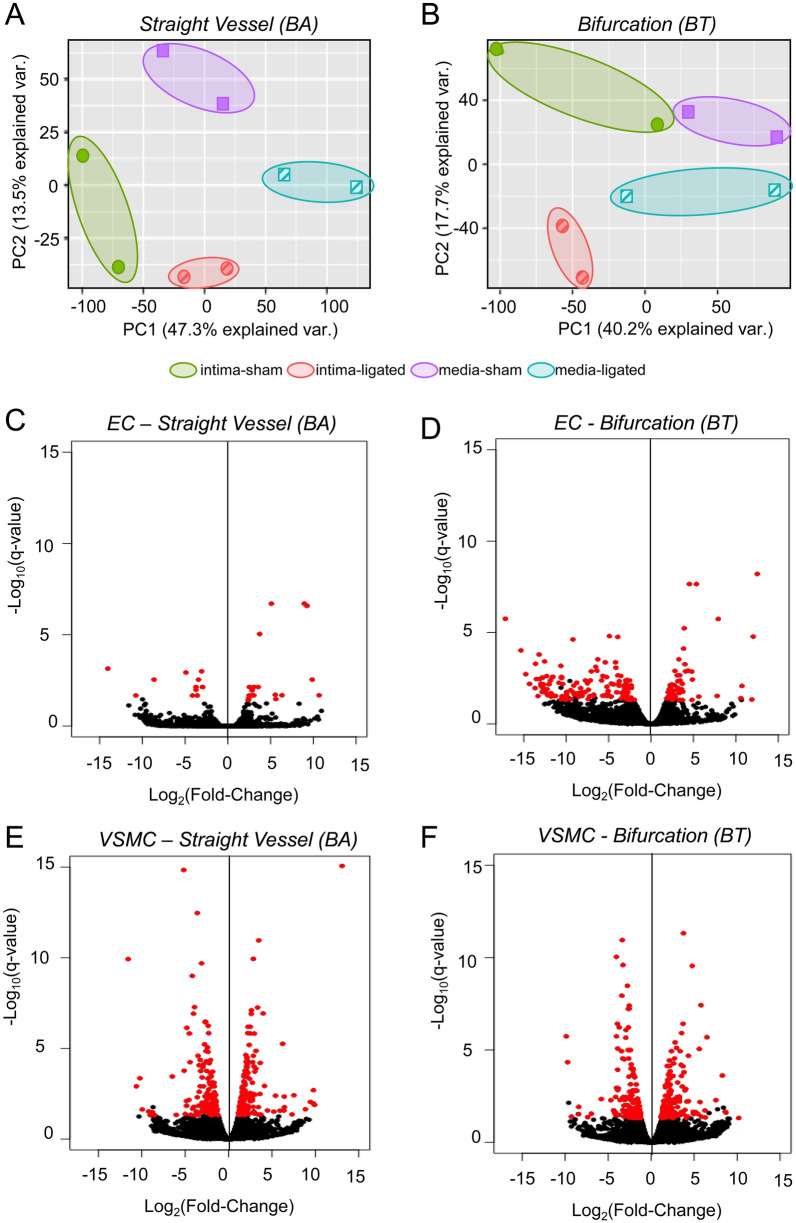
Figure 2.
Principal component analysis of gene expression levels in the 16 samples, and differential expression analysis. (A, B). Principal component analysis was performed on the gene expression levels for all genes that had a count sum > 0 across all samples. The first two principal components for the collective gene expression in each sample are plotted for samples from (A) straight vessel segments and (B) bifurcations. In both cases, intima samples (circles) are spatially separated form media samples (squares). In addition, sham tissues (solid symbols) are distinguished from tissues taken from ligated animals (hatched symbols). Colored ellipses indicate paired duplicates from 2 different rabbits. (C–F) Gene expression in tissues from ligated and unligated rabbits was compared by RNA-seq. Volcano plots show fold change and p-value for comparisons at BA intima (C), BT intima (D), BA media (E), and BT media (F). Each dot represents one gene, and red dots indicate DEGs, i.e. detectable genes with q-value < 0.05.

