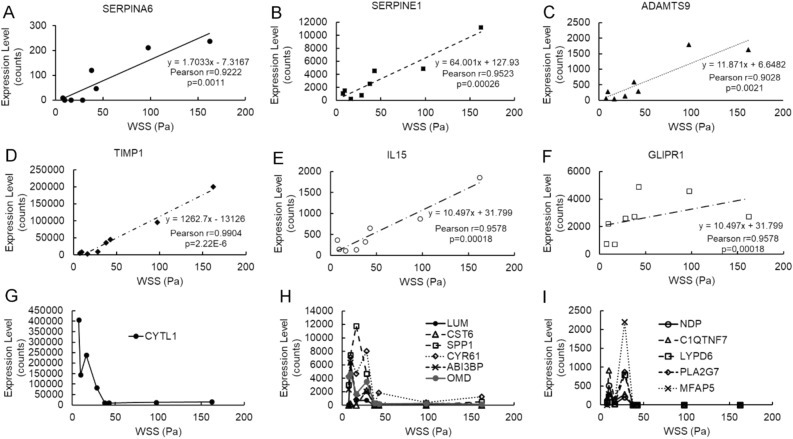
Figure 4.
Gene expression as a function of local WSS. The expression levels for the 18 intimal genes with > 200 medial correlates (as determined by RNA-seq) are shown as a function of the WSS at the sample’s location (as determined by CFD). Expression levels of SERPINE6 (A), SERPINE1 (B), ADAMTS9 (C), TIMP1 (D), and IL15 (E) were all positively correlated with WSS over the full range of observed values (Pearson r > 0.9). GLIPR1 (F) increased with increasing WSS, but plateaued at WSS > 40. The remaining genes displayed very non-linear “dose–response” curves, shown in (G) CYTL1, (H) LUM, CST6, SSP1, CYR61, ABI38P and OMD, and (I). NDP, C1QTNF7, LYPD6, PLA2G7, and MFAP5. The maximal expression values for these 12 genes are all at WSS below 40 Pa, and expression is dramatically lower at WSS > 50 Pa.

