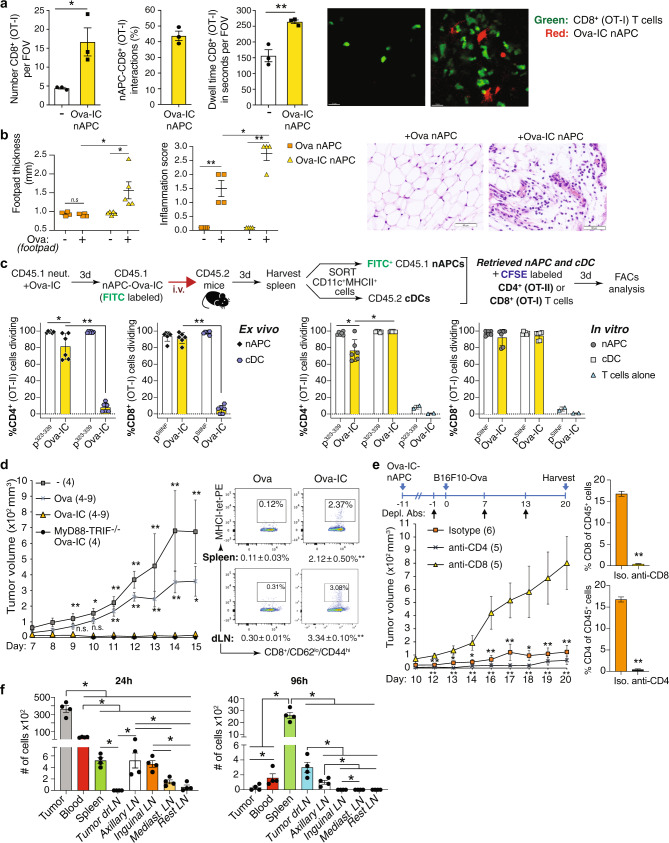
Fig. 4. nAPCs migrate to draining lymph nodes, elicit a delayed-type hypersensitivity (DTH) response, promote anti-tumor immunity, and accumulate in the tumor and draining lymph nodes.
a Ova-IC generated RFP+nAPCs injected in the footpad and GFP-CD8+ T cells injected intravenously detected in the draining lymph node at day 3. Dwell time and number of CD8+ cells in field of view (FOV) and interacting with RFP+nAPC are given. Data are average of three FOV per mouse. Representative images of OT-I cells (green) distribution in areas without (left) and clustering around (red) (right) nAPCs. Scale bar: 15 μm. b DTH response in mice given Ova or Ova-IC generated nAPC in footpad and re-challenged with Ova or vehicle. Footpad swelling and inflammation score are given. Representative images of Ova challenged mice immunized with indicated nAPCs. c Experimental scheme for analysis of “cross-dressing”. Endogenous cDC and Ova-IC loaded nAPCs (injected 3 days prior) were retrieved from spleen and co-cultured with Cell Trace Violet labeled CD4+ (OT-II) and CD8+ (OT-I) T cells ex vivo. In parallel, CD4+ and CD8+ T cell proliferation on in vitro generated Ova-IC-nAPCs and Ova-IC loaded cDCs was assessed. Direct loading of nAPCs and cDCs with Ova-peptide for CD4+ (p323–339) or CD8+ (pSIINFEKL) T cells were controls. Proliferation of CD4+ or CD8+ T cells for ex-vivo (left panels) and in-vitro (right panels) samples are shown. d Tumor volumes in wild-type (WT) mice immunized with no Ova- (−), Ova- or Ova-IC- generated WT nAPCs or Ova-IC-MyD88/TRIF−/− nAPCs 7 days prior to s.c. B16F10-Ova tumor cells (left panel). Number of mice per group is in parenthesis. Flow cytometric plots for MHCI-tetramer-PE+, Ova-specific CD8+ T cells from spleen and draining lymph nodes (dLN) and gated on CD8+CD62loCD44hi population (right panels). e Experimental scheme for examining the effect of CD8+ or CD4+ T cell depleting antibodies (arrows) on Ova-IC-nAPC induced reduction in tumor growth over time (left panel). The number of mice per group is in parenthesis. CD8+ and CD4+ T cell depletion quantitated by FACS analysis of blood samples (right panels). f Quantification of Ova-IC-nAPCs accumulated in organs 24 h or 96 h after their i.v. injection in mice injected 6 days prior with B16F10-Ova cells. Data are mean ± s.e.m. a unpaired student t-test, b, c, d one-way ANOVA and Dunnett’s multiple comparison test, e Two-way ANOVA and Tukey’s multiple comparison test (left panel) and Student t-test for unpaired comparisons with Dunn-Bonferroni (right panel), and f Wilcoxon signed-rank test. *p < 0.05; **p < 0.005.

