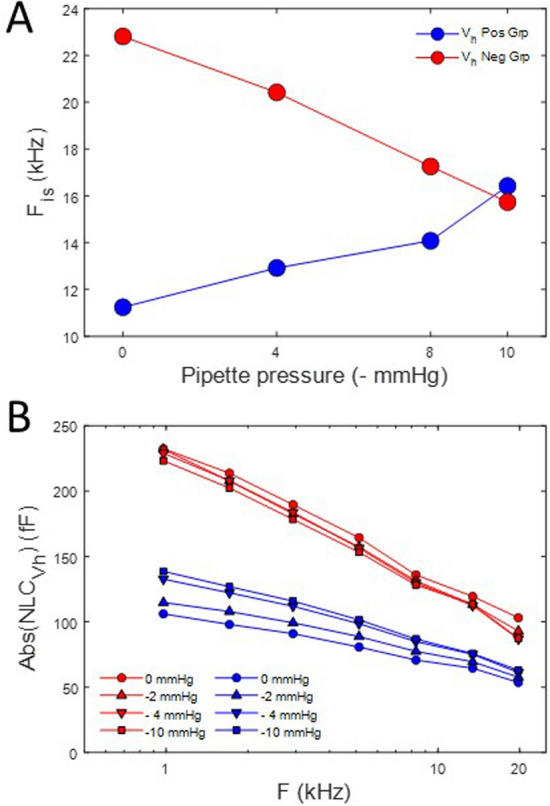
Figure 11.

Summary of initial Vh influence on tension effects. (A) The direction of change in Fis is dependent on initial Vh. Analyses were made with stray capacitance removal using either the + 160 mV (circles) or − 160 mV (asterisks) holding admittance. Results are identical, as expected. The two initial Vh group responses converge until a common Fis vs. tension is reached at − 10 mmHg, namely about 16 kHz. (B) Plot of the absolute magnitude of NLC for the two initial Vh groups. The negative group shows a very similar frequency response regardless of tension, but the positive group shows altered frequency responses, with increases in tension slowing the frequency response.
