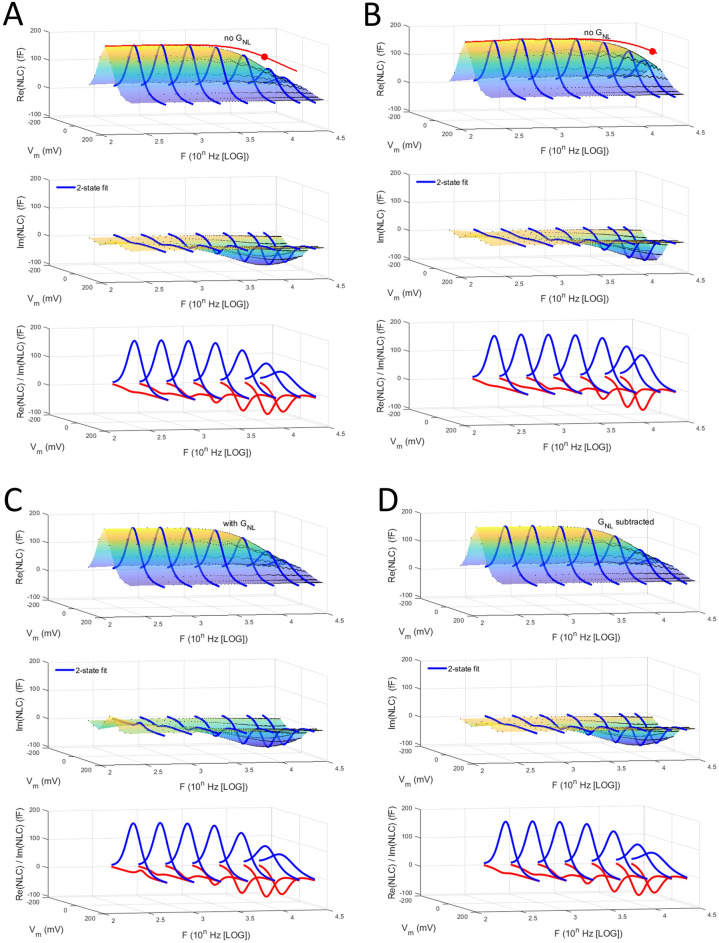
Figure 3.
Real and imaginary components of NLC generated by a solely voltage-dependent 2-state kinetic model (see “Results” section for details), with characteristic cut-offs at Vh dependent on transition rates, α and β. (A) simulations with both rate constants (α0 = β0) equal to 45,000/s, and (B) with both rate constants equal to 90,000/s. In addition to the complex component plots, the absolute magnitude of NLC at Vh is shown with red lines. The rates provide characteristic time constants (tau = 1/(α0 + β0); 11.1 μs and 5.6 μs, respectively) for charge movement in the time domain at the potential Vh. In the frequency domain, the cut-off frequency at Vh is defined as Fc = 1/(tau × 2π), 14.3 and 28.6 kHz, respectively. The filled red circles mark the cut-off frequencies. (C) Same model as in (A), but with an additional nonlinear DC conductance (designed to be like that in our patch data) which distorts the low frequency response of the imaginary component. (D) After removing the DC conductance with the approach detailed in the “Methods” section, the response is essentially the same as in (A), where no DC conductance is included, confirming the validity of our approach to remove any residual DC conductance in our patch data.

