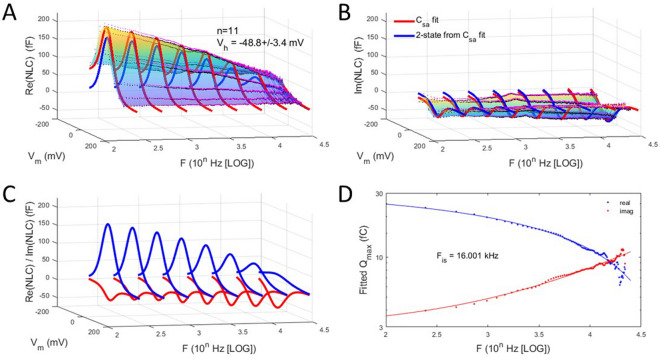
Figure 4.
Complex NLC patch data for patches categorized with Vh more negative than − 30 mV. (A–C) Legends to Fig. 1A–C analogously apply here. (D) Plot of fitted Qmax of 2-state components of complex NLC. The real and imaginary component magnitudes intersect at a particular frequency, Fis. Here the imaginary component absolute magnitude is plotted. Fits (solid lines) are with Eq. (2). Red is real component; blue is imaginary component. Fis is 16 kHz.

