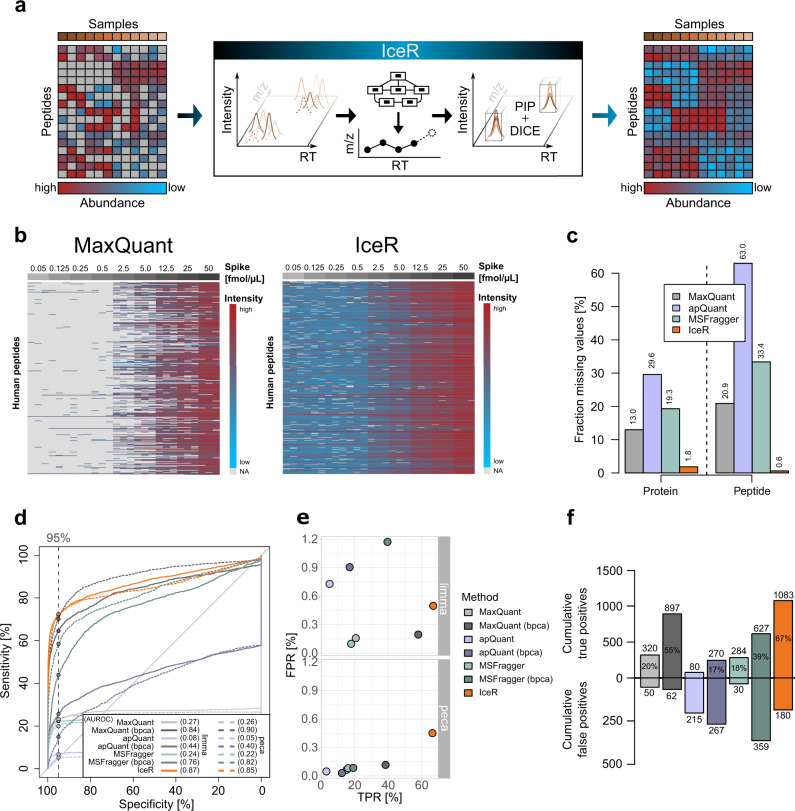
Fig. 1. IceR enables enhanced sensitivity to detect differentially abundant proteins.
a Label-free DDA proteomics typically results in increasing numbers of missing values with increasing sample sizes due to the stochastic principle of precursor selection for fragmentation. IceR addresses this issue by performing robust peptide feature alignment of samples in m/z and chromatographic retention time (RT) space enabling reliable peptide identity propagation (PIP) across samples and highly sensitive and accurate quantification by direct ion current extraction (DICE) quantification. Thereby, IceR highly reduces missing value rates and enables comprehensive, precise and accurate label-free proteomics analyses. b Heatmap representation of quantified peptides of 48 spiked proteins at nine spike amounts into the constant background (n = 3) in MaxQuant (left) and IceR (right) results. Low abundant peptides are coloured blue, high abundant peptides are coloured red, and missing values are indicated in grey. c Fraction of missing values on protein- and peptide-level in MaxQuant (grey), apQuant (purple), MSFragger (green), and IceR (orange) results. d Receiver operating characteristics (ROC) over all pairwise differential expression analyses for MaxQuant (light grey), MaxQuant with bpca imputation (dark grey), apQuant (purple), apQuant with bpca imputation (dark purple), MSFragger (green), MSFragger with bpca imputation (dark green), and IceR (orange) on protein-level using limma (solid line) and peptide-level using peca (dashed line). Area under the ROC (AUROC) per condition is indicated. Dashed vertical line and respective dots represent observed sensitivity at 95% specificity per method. e True and false positive rates over all (36) pairwise DE analyses using limma or peca for MaxQuant (grey), MaxQuant with imputation (dark grey), apQuant (purple), apQuant with bpca imputation (dark purple), MSFragger (green), MSFragger with bpca imputation (dark green), and IceR (orange). f Cumulative true and false positives over all (36) pairwise DE analyses for MaxQuant (grey), MaxQuant with imputation (dark grey), apQuant (purple), apQuant with bpca imputation (dark purple), MSFragger (green), MSFragger with bpca imputation (dark green), and IceR (orange) when using limma. True positive rates are indicated. bpca Bayesian principal component analysis.

