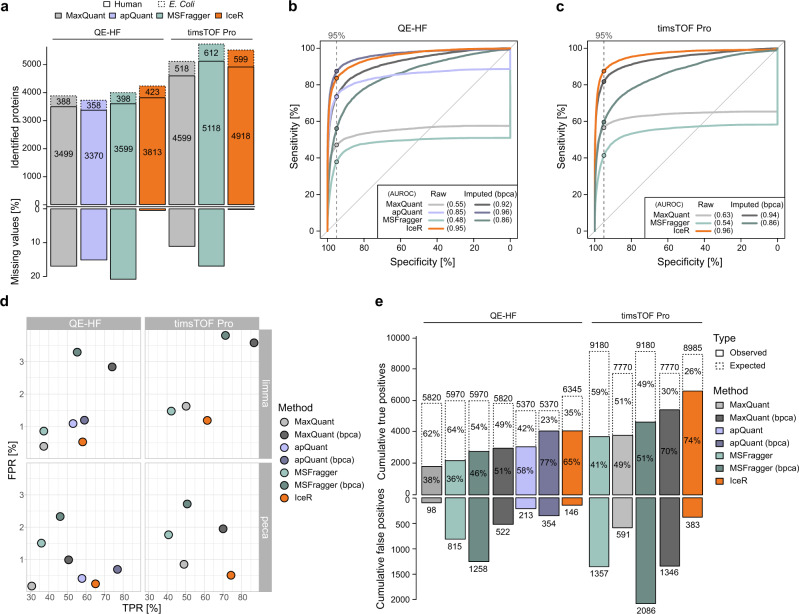
Fig. 5. Application of IceR to timsTOF Pro proteomics data.
a Comparison of numbers of identified human (solid box) and E. coli (dashed box) proteins as well as fraction of missing values in the in-house generated E. coli spike-in data set analysed on a Q Exactive HF (QE-HF) and a timsTOF Pro followed by peptide and protein quantification using MaxQuant (grey), apQuant (purple), MSFragger (green) or IceR (orange). b Receiver operating characteristics (ROC) over all (15) pairwise differential expression analyses on QE-HF data analysed by MaxQuant (light grey), MaxQuant with bpca imputation (dark grey), apQuant (purple), apQuant with bpca imputation (dark purple), MSFragger (green), MSFragger with bpca imputation (dark green), or IceR (orange) on peptide-level using peca. Area under the ROC (AUROC) per condition is indicated. Dashed vertical lines and respective dots represent observed sensitivity at 95% specificity per method. c As in b but showing results for timsTOF Pro data. d True and false-positive rates over all (15) pairwise DE analyses using limma or peca for QE-HF and timsTOF Pro data for MaxQuant (grey), MaxQuant with imputation (dark grey), apQuant (purple), apQuant with bpca imputation (dark purple), MSFragger (green), MSFragger with bpca imputation (dark green), and IceR (orange). e Cumulative true and false positives over all (15) pairwise DE analyses for QE-HF and timsTOF Pro data for MaxQuant (grey), MaxQuant with bpca imputation (dark grey), apQuant (purple), apQuant with bpca imputation (dark purple), MSFragger (green), MSFragger with bpca imputation (dark green), and IceR (orange) when using peca. True positive rates are indicated. bpca—Bayesian principal component analysis.

