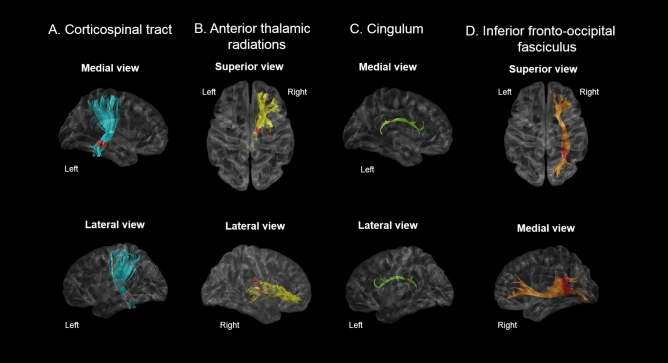
Figure 2.
TSSA results revealed different FA values between RLS patients and control groups for (A) the left corticospinal tract, (B) the right anterior thalamic radiations (C) the left cingulum, and (D) the right inferior fronto-occipital fasciculus. Red colors indicate the portions of fiber tracts where FA values significantly reduced in RLS group compared to controls (p < 0.05). TSSA, tract-specific statistical analysis; FA, fractional anisotropy.

