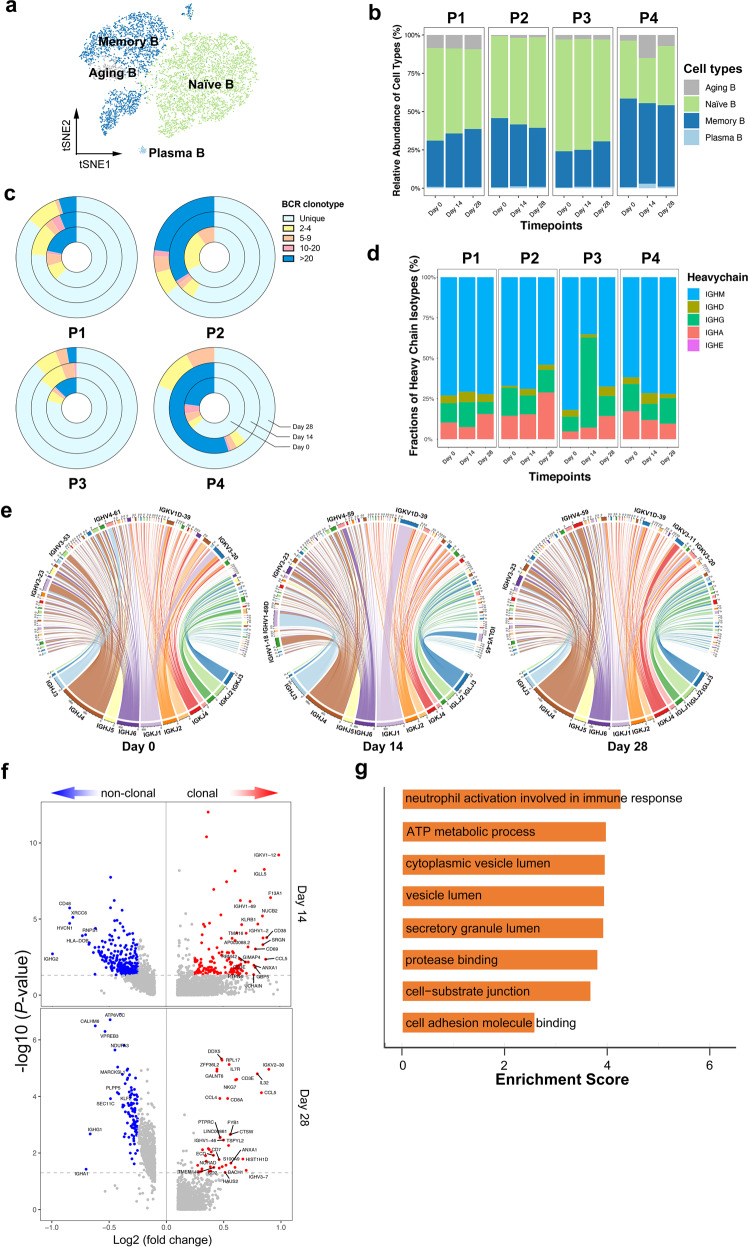
Fig. 2. Humoral immune response and expanded BCR cloning during immunization.
at-SNE analysis of B cells subtypes from all participants and timepoints. b Proportions of the B cell subtypes across participants and timepoints. c The pie plot showing the BCR clone differences across timepoints. The complexity and distribution of clonotypes differed among samples. d The bar plot showing the relative percentage of each isotype by each participant and timepoint. e The circus plots of the rearrangements of the BCR chains split by timepoints. The arc length of each segment corresponds to the relative frequency of each VDJ gene family. Within each plot, pairing VDJ gene segments are represented by colored ribbons. Ribbon width corresponds to frequency of the represented pairing. f The volcano plot showing the DEGs of expanded vs. non-expanded memory B cells and plasma cells at day 14 and day 28 post-vaccination. Genes with greatest fold changes and significant P values were annotated in the plot. g The enriched GO terms of the DEGs in expanded B cells upregulated 28 days post-vaccination.

