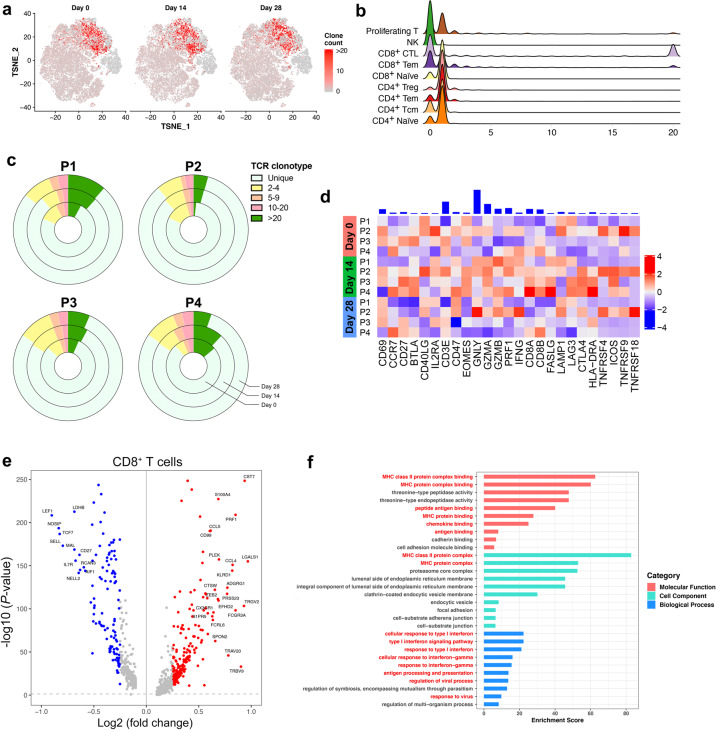
Fig. 5. Dissection of T cells and TCR repertoire.
at-SNE showing expanded TCR clones (n ≥ 2) in the total T cells indicated by timepoints. b Counts of expanded TCR clones in T cell subtypes. c The pie plot showing the TCR clone differences across the different timepoints and individuals. d Heatmap of z-scored mean expression of T cell activation signature (defined as the normalized mean expression of genes in the activation signature in Supplementary Table S4) across T cells from each participants and timepoints. Top, bar plot of total expression of each gene, across all patients. Expression of T cell activation signature shows variability among individuals. e The volcano plot showing the DEGs between CD8+ T cells with expanded and unexpanded TCR clones at day 14 post-vaccination. Genes with greatest fold changes and significant P values were annotated in the plot. f The enriched GO terms of the DEGs between T cells with expanded and unexpanded TCR clones at day 14 post-vaccination. P value was derived by a hypergeometric test.

