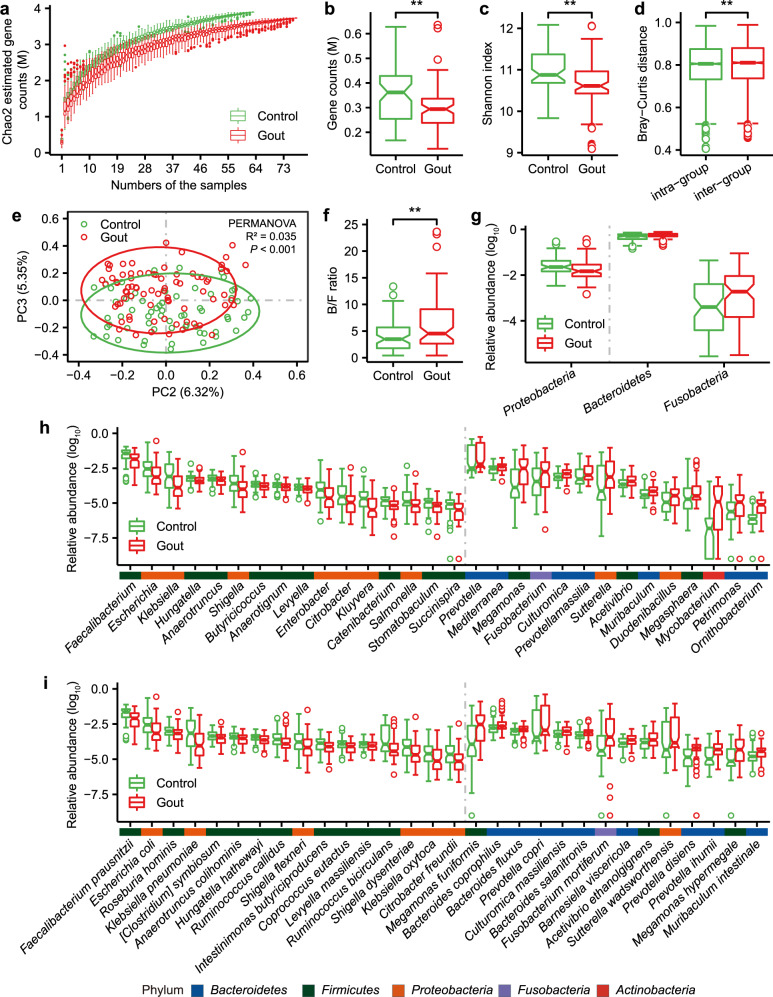
Fig. 1. Gut microbial alterations in gout patients.
a The gene rarefaction curves based on the Chao2 estimated gene counts in healthy controls (n = 63) and gout patients (n = 77) (paired Wilcoxon rank-sum test for median gene counts P = 5.6e–12). b Box and whisker plot of gene count in the healthy controls and gout patients. Wilcoxon rank-sum test was used to determine significance. **P < 0.01. c, d Box and whisker plots of alpha diversity (Shannon index) and beta diversity (Bray–Curtis distance) at the gene level. Wilcoxon rank-sum test was used to determine significance. **P < 0.01. To exclude the influence of the various data sizes among the samples, panels a, b, d and d were based on 11 M matched reads per individual. e Principal component analysis (PCA) based on the gene relative abundance profile. The 95% confidence ellipses were shown for gout and control samples. f The Bacteroidetes/Firmicutes ratio (Wilcoxon rank-sum test; **P < 0.01). The relative abundance of differential phyla (g top 3), genera (h top 30) and species (i top 30) between gout patient and healthy control groups (FDR P < 0.05, Wilcoxon rank-sum test). The color bar above genera or species names were colored according to the phylum. For all box and whisker plots, the center line represents median. The bounds of box represent the first and third quartiles. The upper whisker extends from the hinge to the largest value no further than 1.5 * interquartile range (IQR) from the hinge. The lower whisker extends from the hinge to the smallest value at most 1.5 * IQR of the hinge. The notch represents a confidence interval around the median as the median ± 1.58*IQR/sqrt(n).

