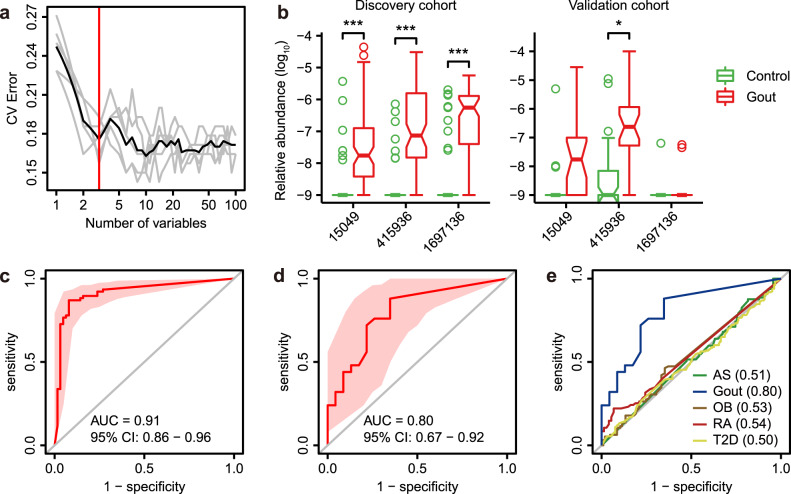
Fig. 4. The gut metagenomic classifier for gout.
a The model was trained using relative abundance of microbial genes in discovery cohort. All microbial genes were first ranked based on their variable importance and then added sequentially into the model. The error curves were plotted for the five trials of 10-fold cross-validation in random forest classification as the number of genes increased. The black curve indicates the average cross-validation error of the five trials (in gray). The minimum error in the averaged curve plus the standard deviation at that point was used as the cutoff for feature selection. The model containing the smallest number of genes with an error below that cutoff was chosen as the optimal classifier. The red line marks the number of genes in the optimized model. b The relative abundance of three microbial gene markers in discovery and validation cohorts. Wilcoxon rank-sum test: ‘asterisk’ denotes FDR P < 0.05; ‘double asterisks’ denote FDR P < 0.01; ‘triple asterisks’ denote FDR P < 0.001. c Receiver operating curve (ROC) for the discovery samples. d ROC for the validation samples (healthy control, n = 23; gout patient, n = 25). e ROCs for gout and four public case-control metagenomic datasets for ankylosing spondylitis (AS), obesity (OB), rheumatic arthritis (RA), and type 2 diabetes (T2D) using three gout-associated gene markers. The AUC for each disease was shown in parenthesis. For all box and whisker plots, the center line represents median. The bounds of box represent the first and third quartiles. The upper whisker extends from the hinge to the largest value no further than 1.5 * interquartile range (IQR) from the hinge. The lower whisker extends from the hinge to the smallest value at most 1.5 * IQR of the hinge. The notch represents a confidence interval around the median as the median ± 1.58*IQR/sqrt(n).

