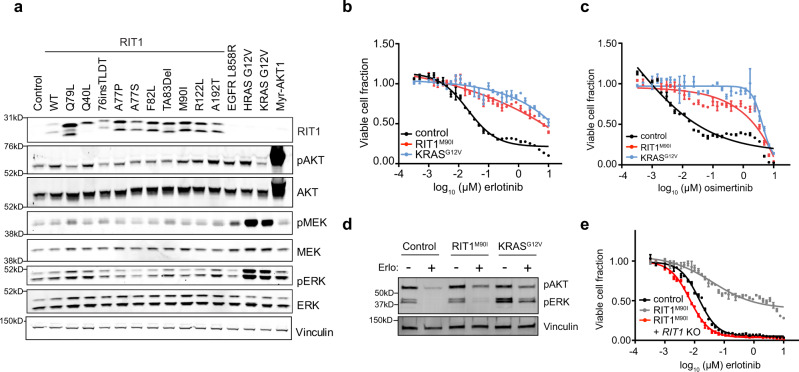
Fig. 1. RIT1M90I and KRASG12V promote resistance to EGFR tyrosine kinase inhibitors.
a Western blot of lysates from NIH3T3 cells stably expressing a panel of RIT1 variants or mutant RAS, EGFRL858R, myristolated AKT1 (Myr-AKT1), or empty vector (control). Vinculin was used as a sample processing control. pAKT, phosphorylated Ser473 AKT1/2/3. pERK, phosphorylated Thr202/Tyr204 ERK1/2. pMEK, phosphorylated Ser217/221 MEK1/2. b Dose–response curve of 96-hour erlotinib treatment in isogenic PC9-Cas9 cells expressing the indicated oncogene or Firefly luciferase (control). CellTiterGlo was used to quantify viable cell number and viable cell fraction determined by normalization to DMSO control. Data shown are the mean ± s.e.m. of two technical replicates. c Dose–response curve of osimertinib, performed as in (b). Data shown are the mean ± s.e.m. of two technical replicates. d Western blot of lysates from cells shown in (b, c), cultured in the absence or presence of 500 nM erlotinib for 72 h. pAKT, phosphorylated Ser473 AKT1/2/3. pERK, phosphorylated Thr202/Tyr204 ERK1/2. Vinculin was used as a loading control. Blot representative of n = 2 independent experiments. e Dose–response curve of 96 h erlotinib treatment in clonal RIT1 knockout (KO) cells compared to parental PC9-Cas9-RIT1M90I cells or control PC9 cells. Data generated and presented as in (b). Data shown are the mean ± s.d. of two technical replicates. Unless otherwise indicated, all data are representative results from n = 2 independent experiments. Source data are provided as a Source Data file.

