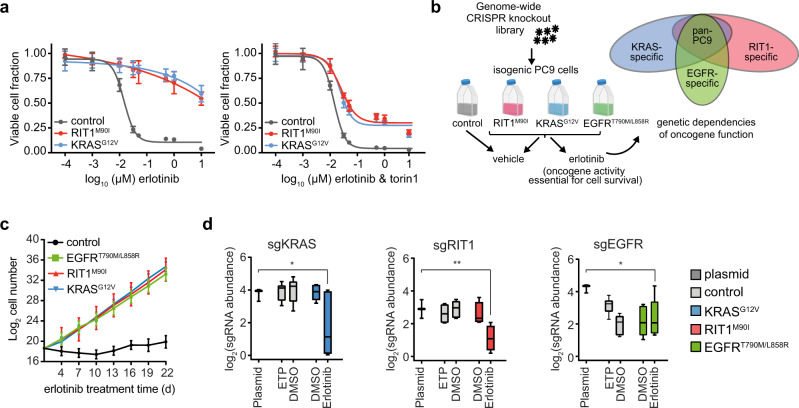
Fig. 2. Building an integrative oncogene-dependency map of EGFRT790M/L858R, KRASG12V, and RIT1M90I.
a 96-hour dose–response of isogenic PC9 cells to erlotinib alone (left panel) or to a 1:1 molar ratio of erlotinib and torin1 (right panel). Fraction of viable cells was determined using CellTiterGlo and normalized to the average value in DMSO treated cells. Data shown are the mean ± s.d. of 8 technical replicates. b Schematic of the genome-wide CRISPR-Cas9 screens performed in isogenic PC9 cells. Created with BioRender.com. c, Proliferation rates of the PC9-Cas9 isogenic cells used for genome-wide screening in 50 nM erlotinib. Data shown are the mean ± 95% confidence interval for two replicates per cell line. d Box plot showing sgRNA abundance (log2 reads per million) of sgRNAs targeting each indicated gene. Abundance in the plasmid library, early time point (ETP), or after 12 population doublings in vehicle (DMSO) or erlotinib was determined by PCR and Illumina sequencing. Box plots show the median (center line), first and third quartiles (box edges), and the min and max range (whiskers) of replicates. * p = 0.022 (sgKRAS), ** p = 0.009 (sgRIT1), * p = 0.004 (sgEGFR) calculated by one-sided permutation testing using MAGeCK. For control PC9 cells ETP and DMSO, n = 3 biological replicates. For oncogene-expressing PC9 cells DMSO and erlotinib, n = 2 biological replicates. Source data are provided as a Source Data file.

