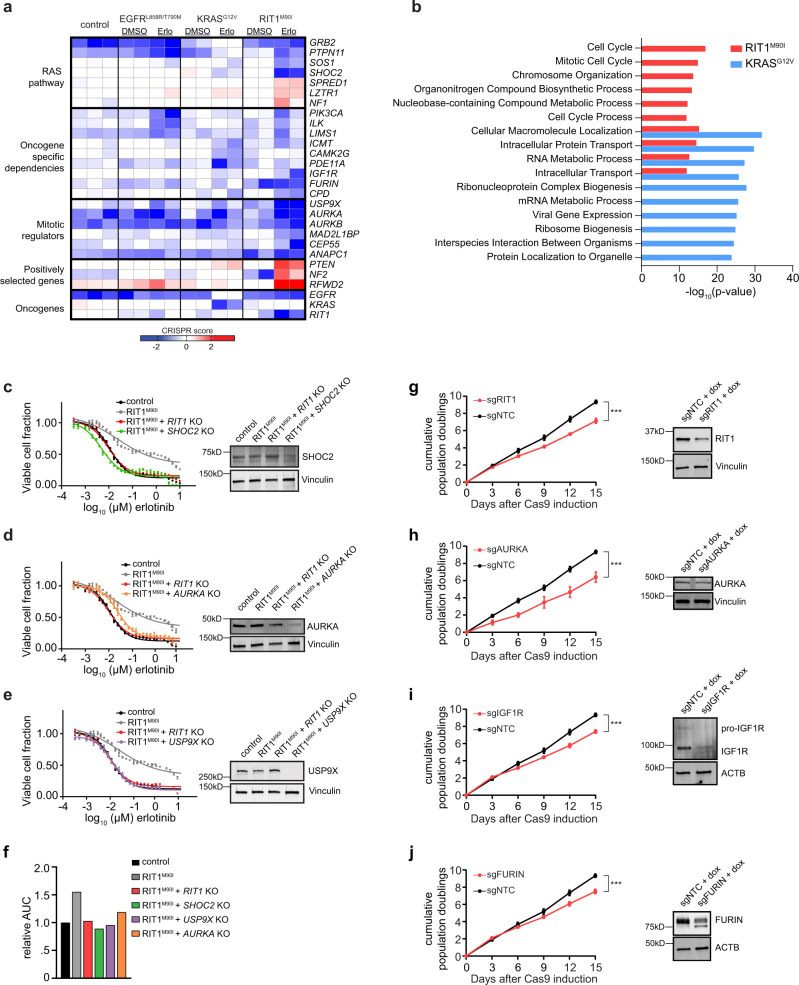
Fig. 4. RIT1-mutant cells are vulnerable to loss of RAS pathway and cell cycle genes.
a Heatmap illustrating the CS of selected dependencies clustered by biological pathway. Each column is a different replicate and shows CS between erlotinib or DMSO versus plasmid. b MSigDB overlap analysis of the GO Biological Process gene sets significantly enriched in the top 500 PC9-Cas9-RIT1M90I and PC9-Cas9-KRASG12V essential genes. c–e Left, 96-hour dose–response curve of erlotinib in clonal SHOC2 knockout (KO), AURKA KO, or USP9X KO cells derived from PC9-Cas9-RIT1M90I cells. The same data for control and PC9-Cas9-RIT1M90I and RIT1 KO cells are plotted on each panel for reference. Data shown are the mean ± s.d. of two technical replicates. Right, Western blot for SHOC2, AURKA, or USP9X expression in clonal knockout cells derived from PC9-Cas9-RIT1M90I cells. Vinculin was used as a loading control. f Area-under-the-curve (AUC) analysis of data from panels (c–e). g-j Left, Cumulative population doublings of H2110iCas9 cells grown in the presence of doxycycline (+dox) expressing the indicated sgRNAs compared to cells expressing non-targeting control sgRNA (sgNTC). The same data for sgNTC is shown on each panel for reference. Data shown are the mean ± s.d. of three technical replicates. *** p < 0.001 (g *** p = 0.0005. h *** p = 0.001. i *** p = 0.0003. j *** p = 0.0007.) by unpaired two-tailed t-test. Right, Western blot of day 5 lysates generated from parental H2110iCas9 or pooled RIT1 KO, AURKA KO, IGF1R KO, or FURIN KO cells. Vinculin or Actin (ACTB) was used as a loading control. Source data are provided as a Source Data file.

