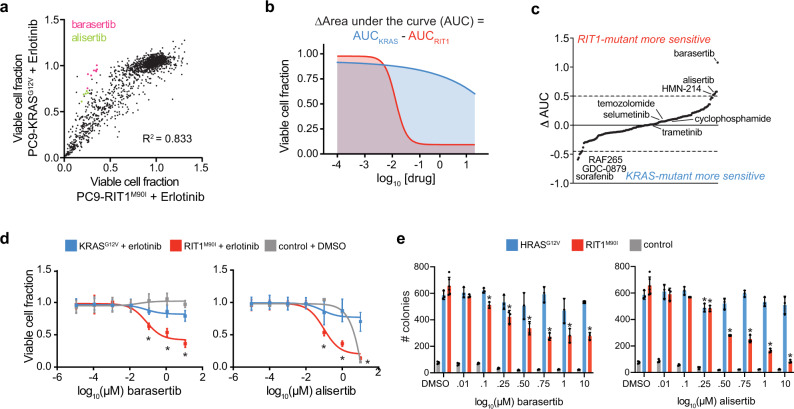
Fig. 5. RIT1-mutant cells are sensitive to Aurora kinase inhibition.
a Drug sensitivity screen of 160 small molecules, 8 doses per compound, in isogenic PC9-RIT1M90I and PC9-KRASG12V treated in combination with each test condition and 500 nM erlotinib for 96-hours. Data shown are the mean of two replicates of each individual dose/compound. Viable cell fraction was calculated by normalizing CellTiterGlo luminescence in the test condition to CellTiterGlo luminescence of cells treated only with 500 nM erlotinib. b Schematic illustrating differential ‘area-under-the-curve’ (AUC) analysis. c ΔAUC analysis of 160 small molecules generated from data shown in (a) and calculated as in (b). Each dot represents a different compound. ΔAUC are median-centered and plotted from least to greatest. d Validation of enhanced response to barasertib, left, or alisertib, right. Data shown are mean ± s.d. of n = 16 replicates per dose. * p < 0.05 by unpaired two-tailed t-test. e Soft agar colony formation in NIH3T3 cells expressing RIT1M90I, HRASG12V or empty vector (control). Data shown are the mean ± s.d. of n = 3+ replicates for all conditions except for the 0.5 μM barasertib-treated RIT1M90I cells (n = 2). * p < 0.05 by unpaired two-tailed t-test. Source data are provided as a Source Data file.

