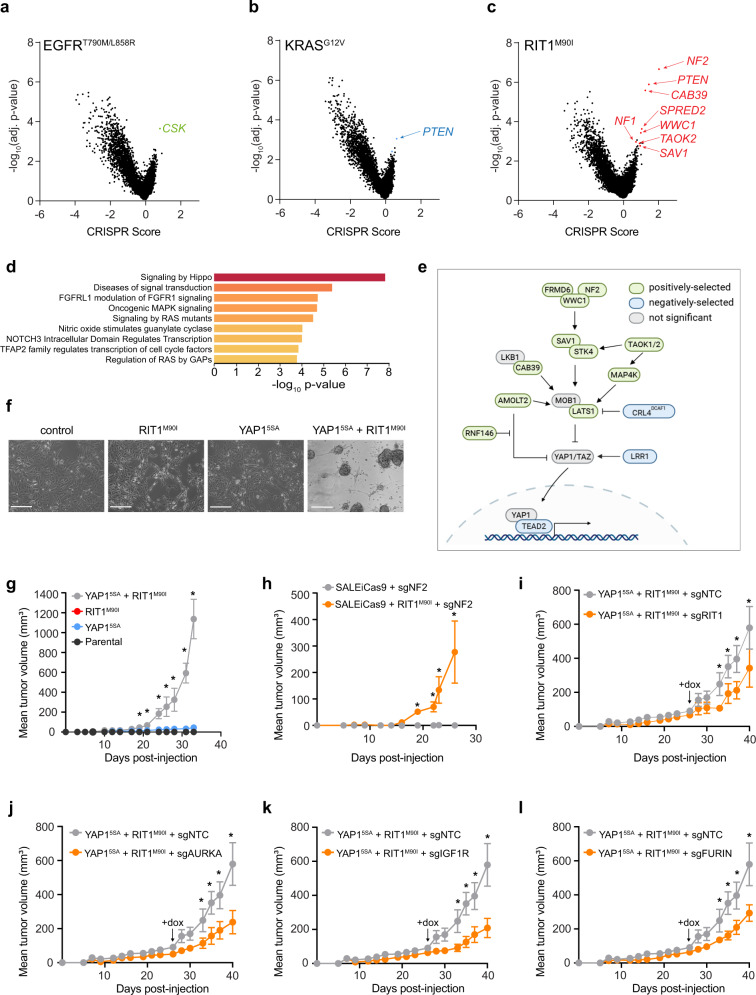
Fig. 7. Hippo pathway inactivation synergizes with RIT1M90I to promote cell survival and proliferation.
a–c Volcano plots of genome-wide CRISPR screening data from (a) PC9-Cas9-EGFRT790M/L858R cells, (b) PC9-Cas9-KRASG12V cells and (c) PC9-Cas9-RIT1M90I cells cultured in 40 nM erlotinib for 12 population doublings. CRISPR Score indicates the normalized log2 (fold-change) of the average of 4 sgRNAs per gene in two biological replicates in erlotinib compared to the starting abundance in the plasmid library. d MSigDB overlap analysis of the top REACTOME gene sets in RIT1M90I positively selected gene knockouts (p < 0.05, CRISPR score > 0.5). e Depiction of positively selected (green) and negatively selected (blue) Hippo pathway components identified in PC9-Cas9-RIT1M90I (|CS| > 0.5 and p < 0.05). Schematic created partially with Biorender.com. f Phase contrast images of SALEiCas9 cells (control) or expressing RIT1M90I, the constitutively nuclear-localized YAP15SA, or RIT1M90I and YAP15SA. Scale bar = 200 µm. Representative images from n = 3 independent experiments are shown. g Xenograft assay of SALEiCas9 cells expressing RIT1M90I, YAP15SA, or combined RIT1M90I and YAP15SA in immunocompromised mice. Data shown are the mean ± s.e.m. of n = 6 tumors per group. * p < 0.05 by unpaired two-tailed t-test. h Xenograft assay of SALEiCas9 cells expressing sgNF2, or combined RIT1M90I and sgNF2 in immunocompromised mice. Data shown are the mean ± s.e.m. of n = 8 tumors per group. * p < 0.05 by unpaired two-tailed t-test. i-l Xenograft assays of SALEiCas9-RIT1M90I + YAP15SA cells transduced with non-targeting control sgRNAs (sgNTC) or RIT1-, AURKA-, IGF1R, or FURIN-targeting sgRNAs (n = 8 tumors per sgRNA). Cells were pre-treated with doxcycyline in vitro for 5 days and re-induced at day 26 (arrow) in vivo with doxycycline-containing chow. * p < 0.05 by unpaired two-tailed t-test. Source data are provided as a Source Data file.

