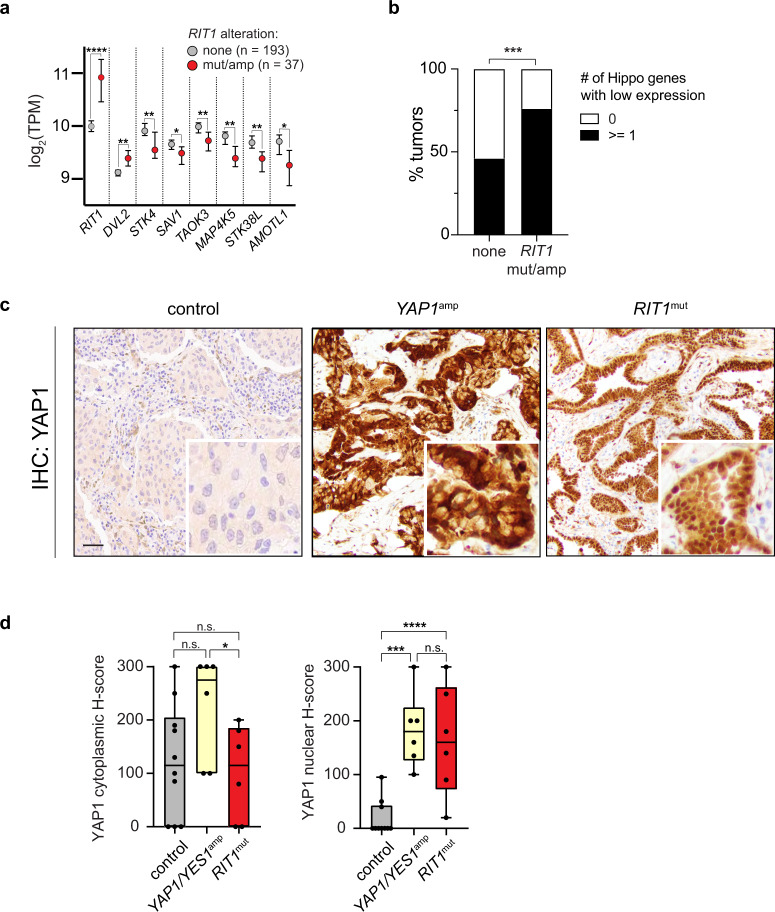
Fig. 8. Hippo pathway loss and YAP1 nuclear overexpression in RIT1-mutant human lung tumors.
a RNA-sequencing data of human lung adenocarcinomas from TCGA. Data shown are the median ± 95% confidence interval of log2-transformed transcripts per million (TPM) in RIT1-altered (amplified or mutated, n = 37) tumors compared to RIT1 non-altered tumors (n = 193). * p < 0.05, ** p < 0.01, **** p < 0.0001 by unpaired two-tailed t-test (RIT1: **** p = 1.84e−11, DVL2: ** p = 0.0025, STK4: ** p = 0.0011, SAV1: * p = 0.0278, TAOK3: ** p = 0.0052, MAP4K5: ** p = 0.0023, STK38L: ** p = 0.0023, AMOTL1: * p = 0.0384). b Proportion of control or RIT1 amplified or mutated (mut/amp) tumors with low expression of any one Hippo pathway gene; see Methods. *** p = 0.0006 by one-tailed Fisher’s exact test. c Representative low magnification images and inset zoom of YAP1 IHC in human lung tumor samples, control, YAP1-amplified, and RIT1-mutant, scale bar = 100 µm. n = 6–10 tumors per condition were analyzed d H-score quantification of control, YAP1/YES1-amplified, and RIT1-mutant human lung tumor samples (Supplementary Data 8). H-Score = % of positive cells multiplied by intensity score of 0–3; see Methods. n = 6–10 tumors per condition were analyzed. Box plots show the median (center line), first and third quartiles (box edges), and the min and max range (whiskers). n.s., p > 0.05, * p = 0.046, *** p = 0.0009, **** p < 0.0001 by unpaired two-tailed t-test. Source data are provided as a Source Data file.

