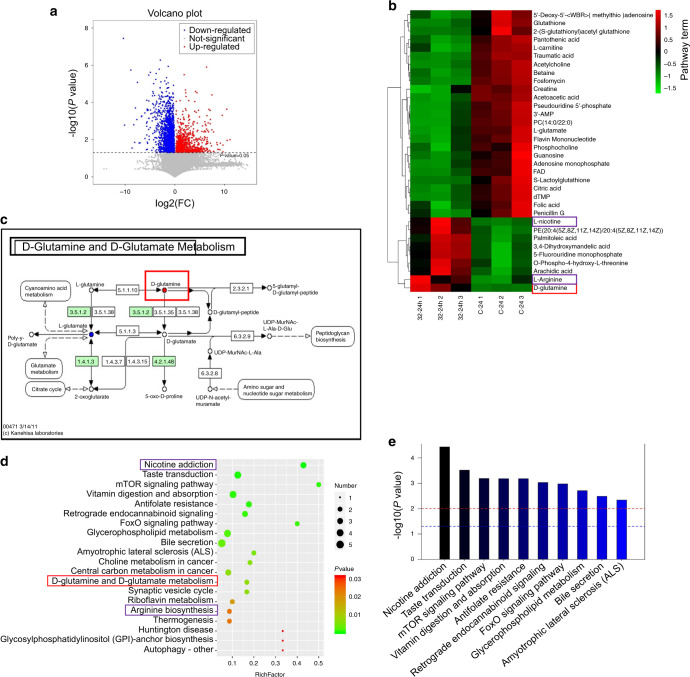
Fig. 3.
Metabolites and the enrichment pathways of the CSE group compared to the controls. In the volcanic plots, red, blue, and gray dots, respectively, represent upregulated, downregulated, and nonsignificant differential metabolites. Comparing the CSE group with the control group, 162 differential metabolites were detected by LC-MS (P < 0.05) (a). c Shows the d-glutamine and d-glutamate metabolism. Heatmaps of metabolites that can be enriched into known metabolic pathways (b). The significant enrichment pathway is selected for bubble mapping (d) and a histogram (e). The P value in the metabolic pathway is the significance of enrichment of this metabolic pathway. The abscissa is the enrichment factor (Rich factor, Rich factor = significantly different number of metabolites/total number of metabolites in the pathway). The greater the Rich factor is, the greater the enrichment degree will be. The color from red to green indicates that the P value decreases successively. The larger the dot is, the more metabolites are enriched in this pathway. In panel e, the red line indicates the P value of 0.01, and the blue line indicates the P value of 0.05. When the top of the bar is higher than the blue line, the signal pathway represented by it is significant

