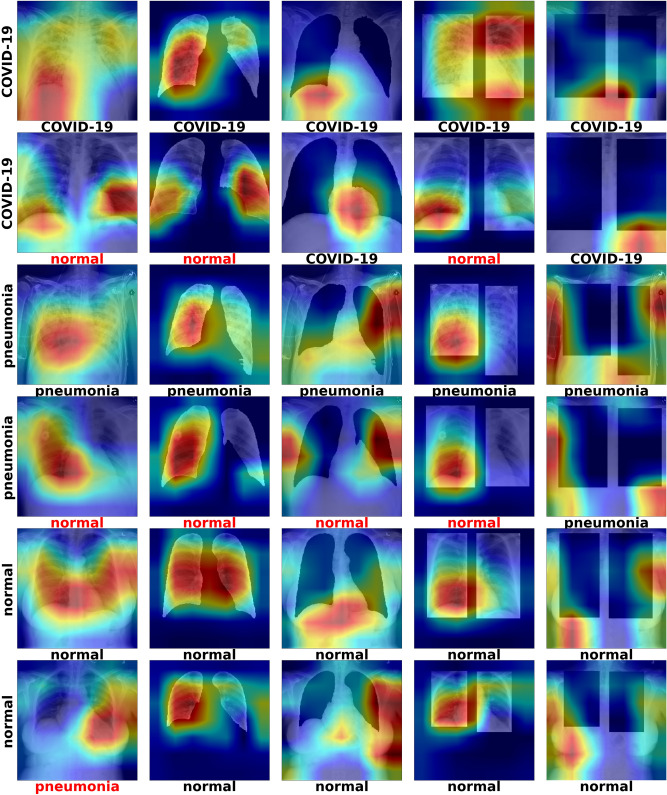
Figure 3.
Grad-CAM of ResNet-50 models—the label on the left side of each row corresponds to the ground-truth label of that image (COVID-19, Pneumonia, Normal). Each image in each row corresponds to the Grad-CAM inference result on the different modified test sets (data, data_lungs_isolated, data_lungs_removed, data_lungs_framed, data_lungs_boxed_out). The label underneath the individual images corresponds to the classification label generated by the network corresponding to that modified version of the dataset.

