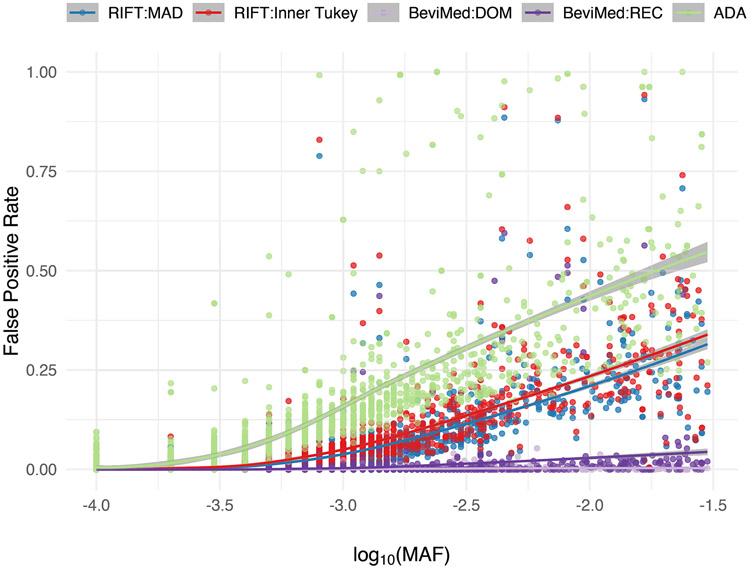
Figure 5. False positive rate (proportion incorrectly labeled IV) for variants under the null for each localization method as a function of MAF.
Smoothed line and confidence band provided by the loess method. Data were simulated to have 10% variants under the alternative with effect size parameter c = 0.4 (see Equation 5).

