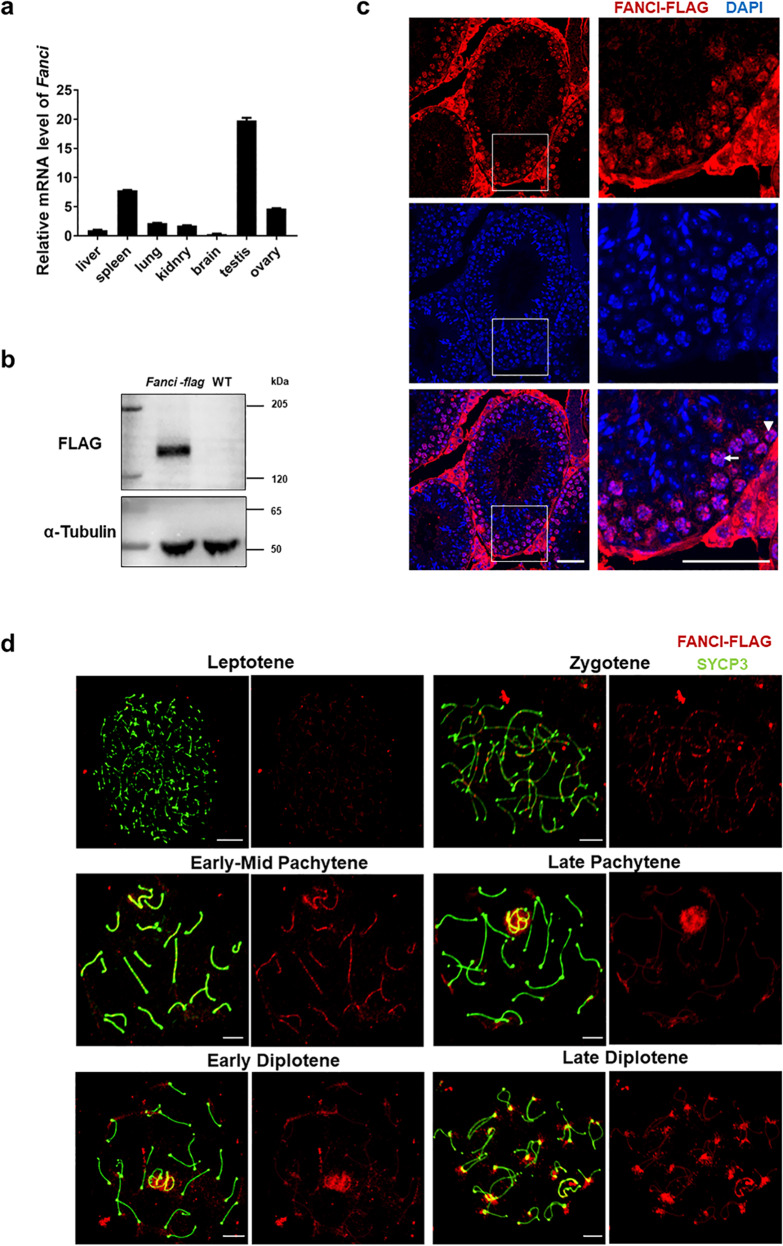
Fig. 1. Temporal and spatial expression of FANCI during meiotic prophase I.
a Relative mRNA level of Fanci in various tissues. Data are presented as mean ± SD. b Western blot analysis of the wild type and Fanci-flag testes (8 weeks old). α-Tubulin was used as a loading control. c Expression and localization of FANCI in adult testes. Immunofluorescence analysis of FLAG was performed on paraffin sections from Fanci-flag testes. The nuclei were stained with DAPI. Arrowhead represents spermatogonia. Arrow represents spermatocyte. Scale bars, 20 μm. d Localization of FANCI in chromosome spread of Fanci-flag spermatocytes. Meiotic chromosome spreads were immunolabeled with anti-FLAG and anti-SYCP3 antibodies. Scale bars, 5 μm.

