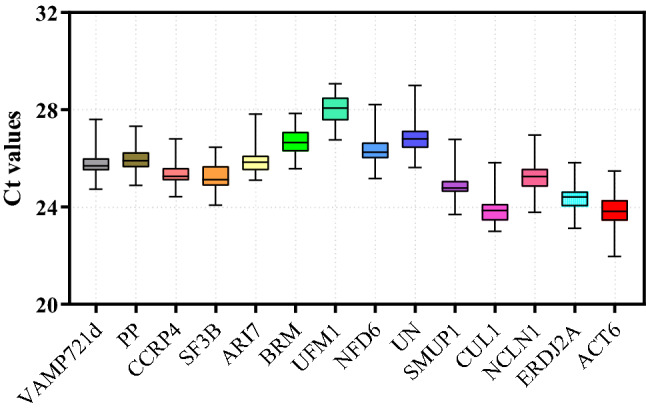
Fig. 1.

Distribution of Ct values of 14 candidate reference genes in all experimental samples. Expression levels of 14 candidate reference genes used in the study. Expression levels data RT-qPCR quantification computed tomography (Ct) values for each gene in different tissues (root\stem\leaf) and experimental conditions (MeJA\ABA\SA\Salt). The box plot indicates the 25th and 75th percentiles, and whisker caps represent the maximum and minimum values
