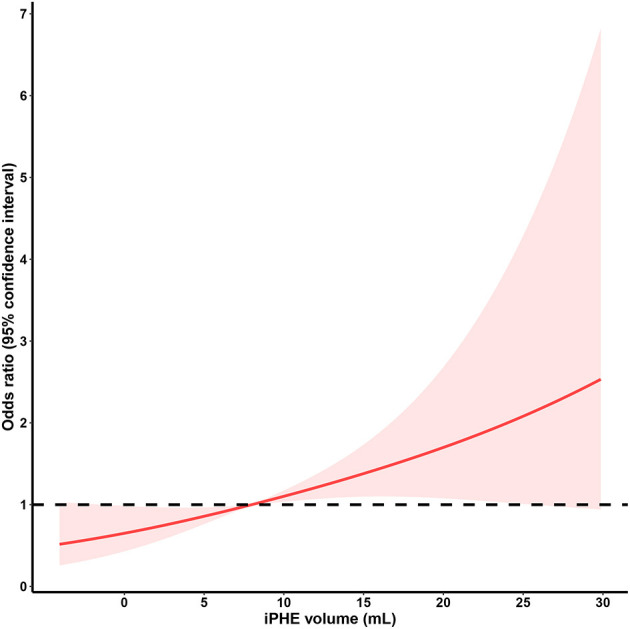
Figure 2.

Restricted cubic spline analysis of the association between iPHE volume and poor outcome OR (The middle solid line indicates the point estimates of odds ratios and the shaded part indicate the lower and upper limits of the corresponding 95% confidence intervals. The horizontal dashed line was at odds ratio =1 (reference point: 7.98 mL). Three knots were used for the restricted cubic spline analysis).
