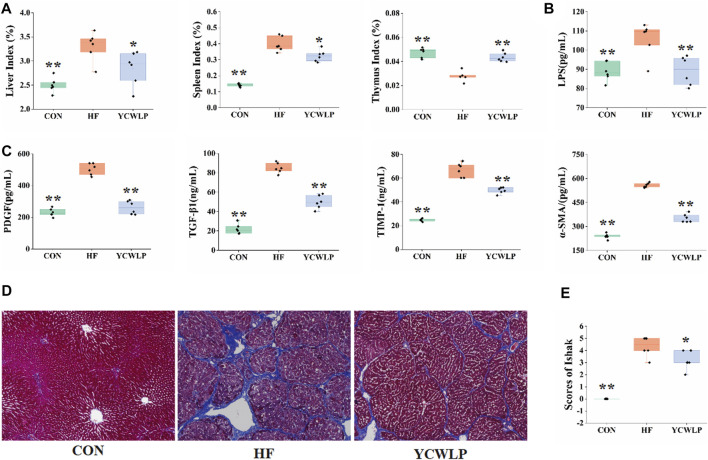
FIGURE 1.
Effect of YCWLP on the CCl4−induced HF (n = 6). (A) Liver, spleen and thymus indices; (B) LPS in the plasma samples; (C) The expression of PDGF, TGF-β1, TIMP-1 and α-SMA in the liver samples. (D) Masson’s trichrome staining of rat liver tissue. Magnification ×100; (E) Ishak scores based on Masson’s trichrome staining of rat liver tissue. Significant difference compared with the HF group: * p-value < 0.05; ** p-value < 0.01.

